
Overcapacities Dashboard
Overcapacities Dashboard
China’s ever-increasing production and persistently lagging consumption create spillovers that distort markets globally . The resulting industrial overcapacity issues emanating from China are growing, both to the detriment of China’s own economy and for its many trading partners. On paper, Beijing aims to deal with some of the consequences with its fight against ‘involution’ – the excess competition and race to the bottom on prices happening within China. So far, anti-involution campaigns have not managed to achieve the kind of industrial consolidation needed to resolve overcapacity issues.
Close monitoring of the indicators of overcapacity is needed to systematically track the success, stagnation, and/or failure of anti-involution efforts. To do so, MERICS has developed and will regularly update this Overcapacity Dashboard, which includes charts covering four main areas:
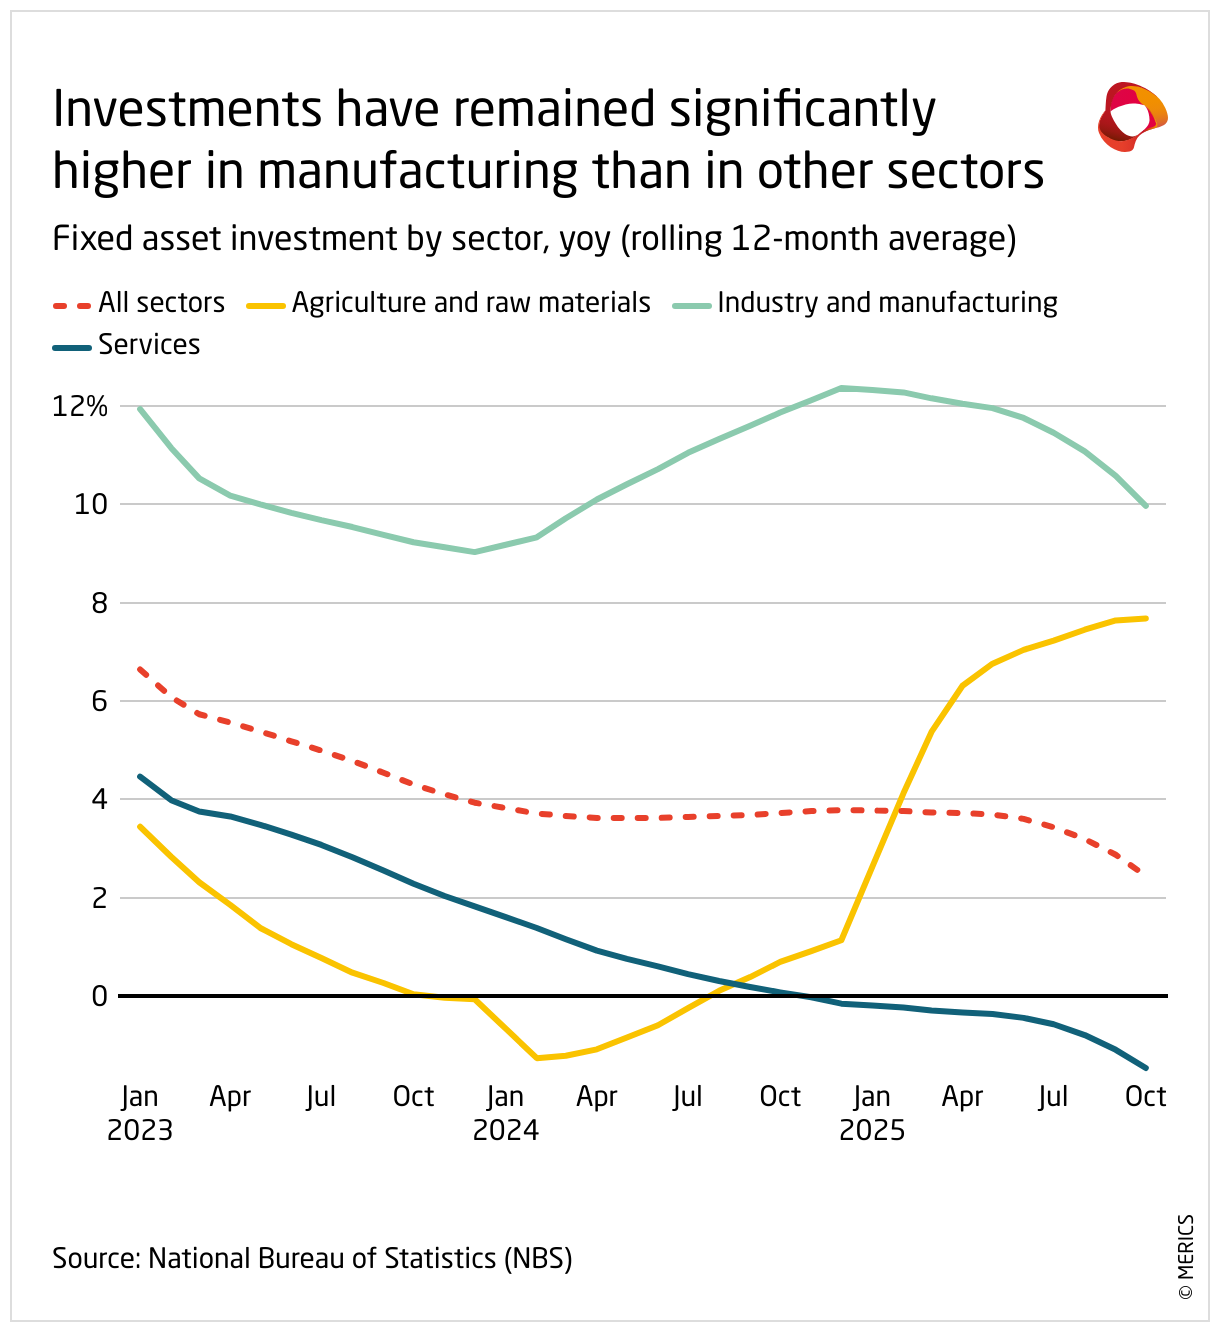
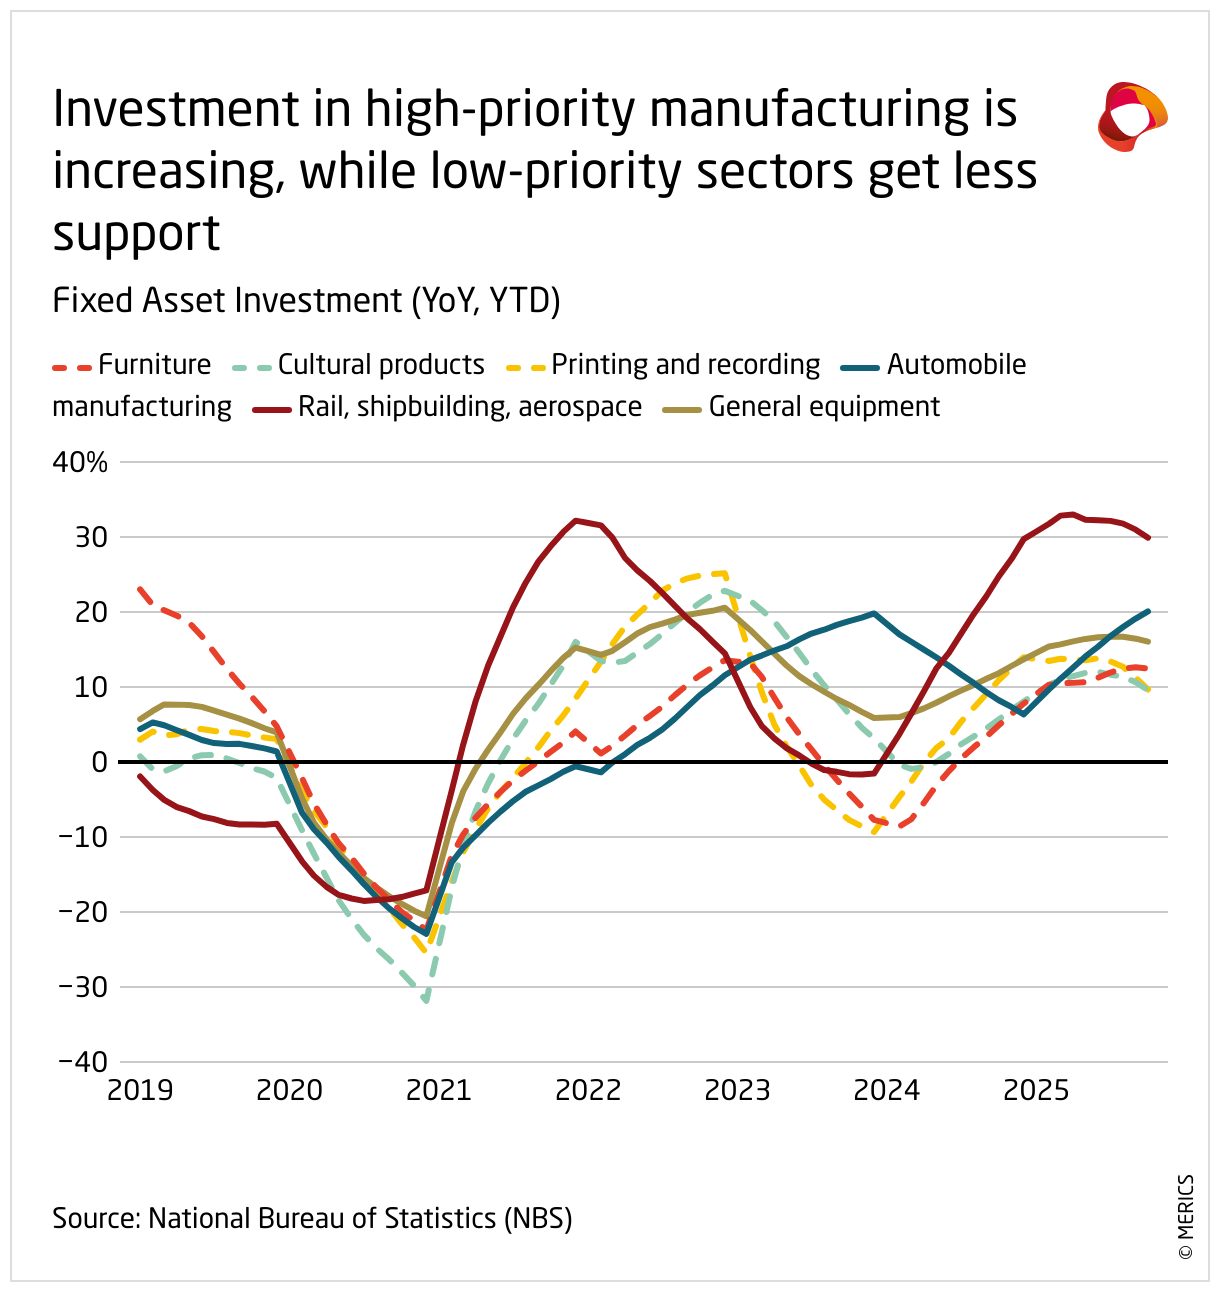
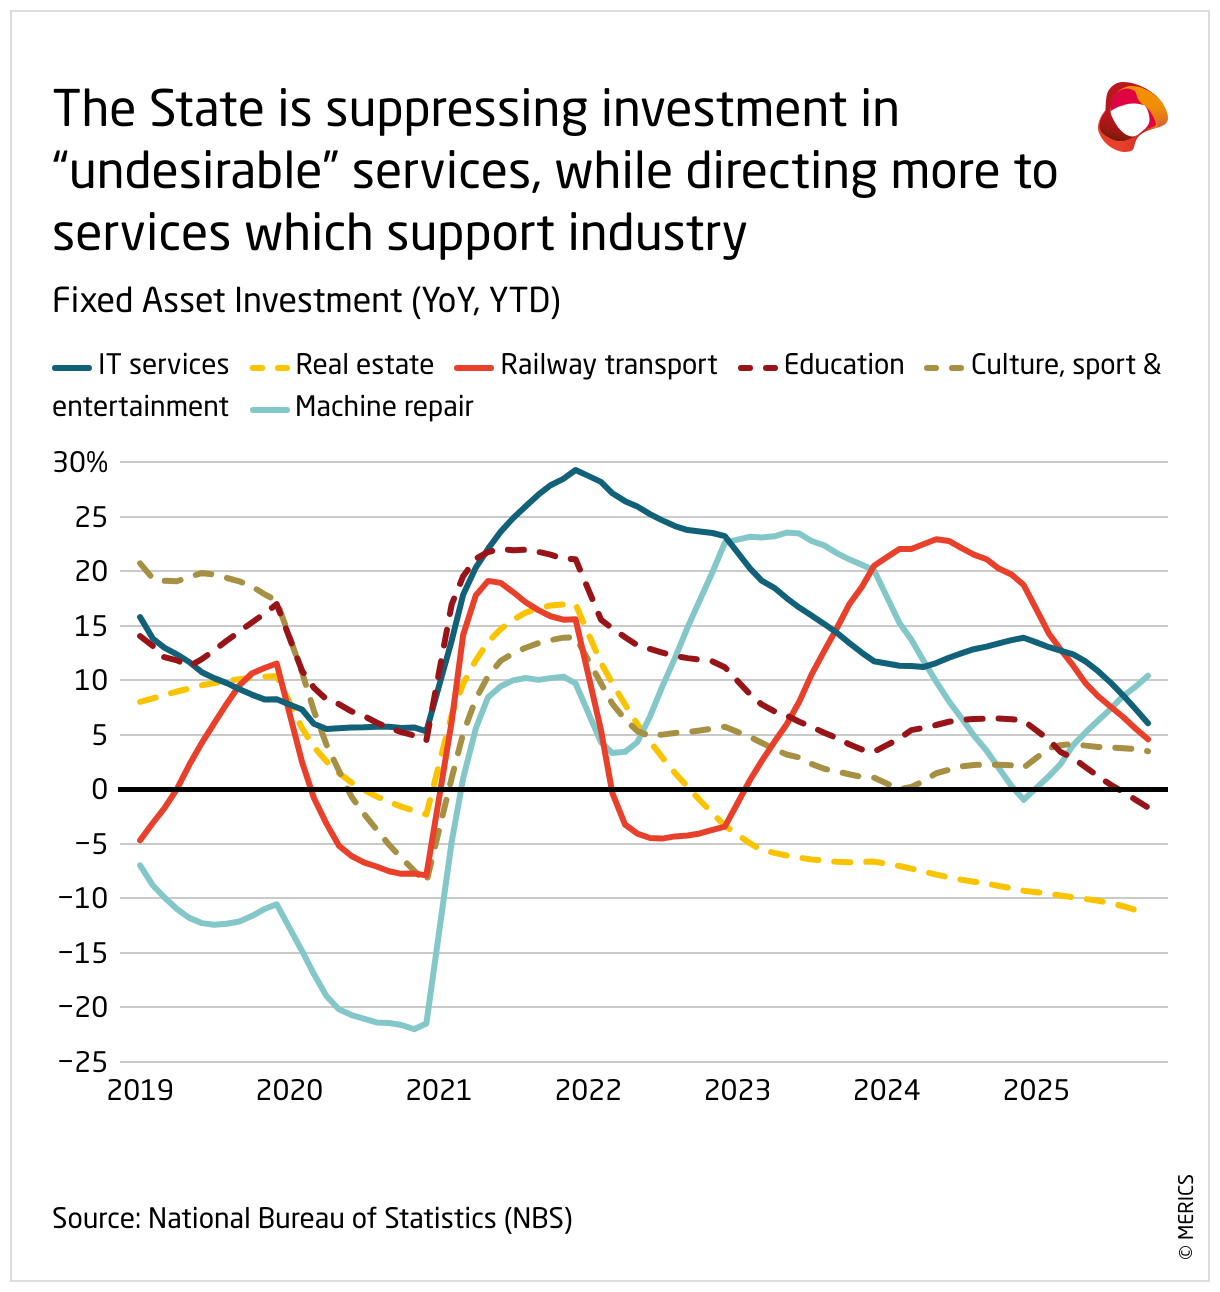
- Evolution of investments
- Capacity growth and consumption
- Impact on companies’ profits and losses
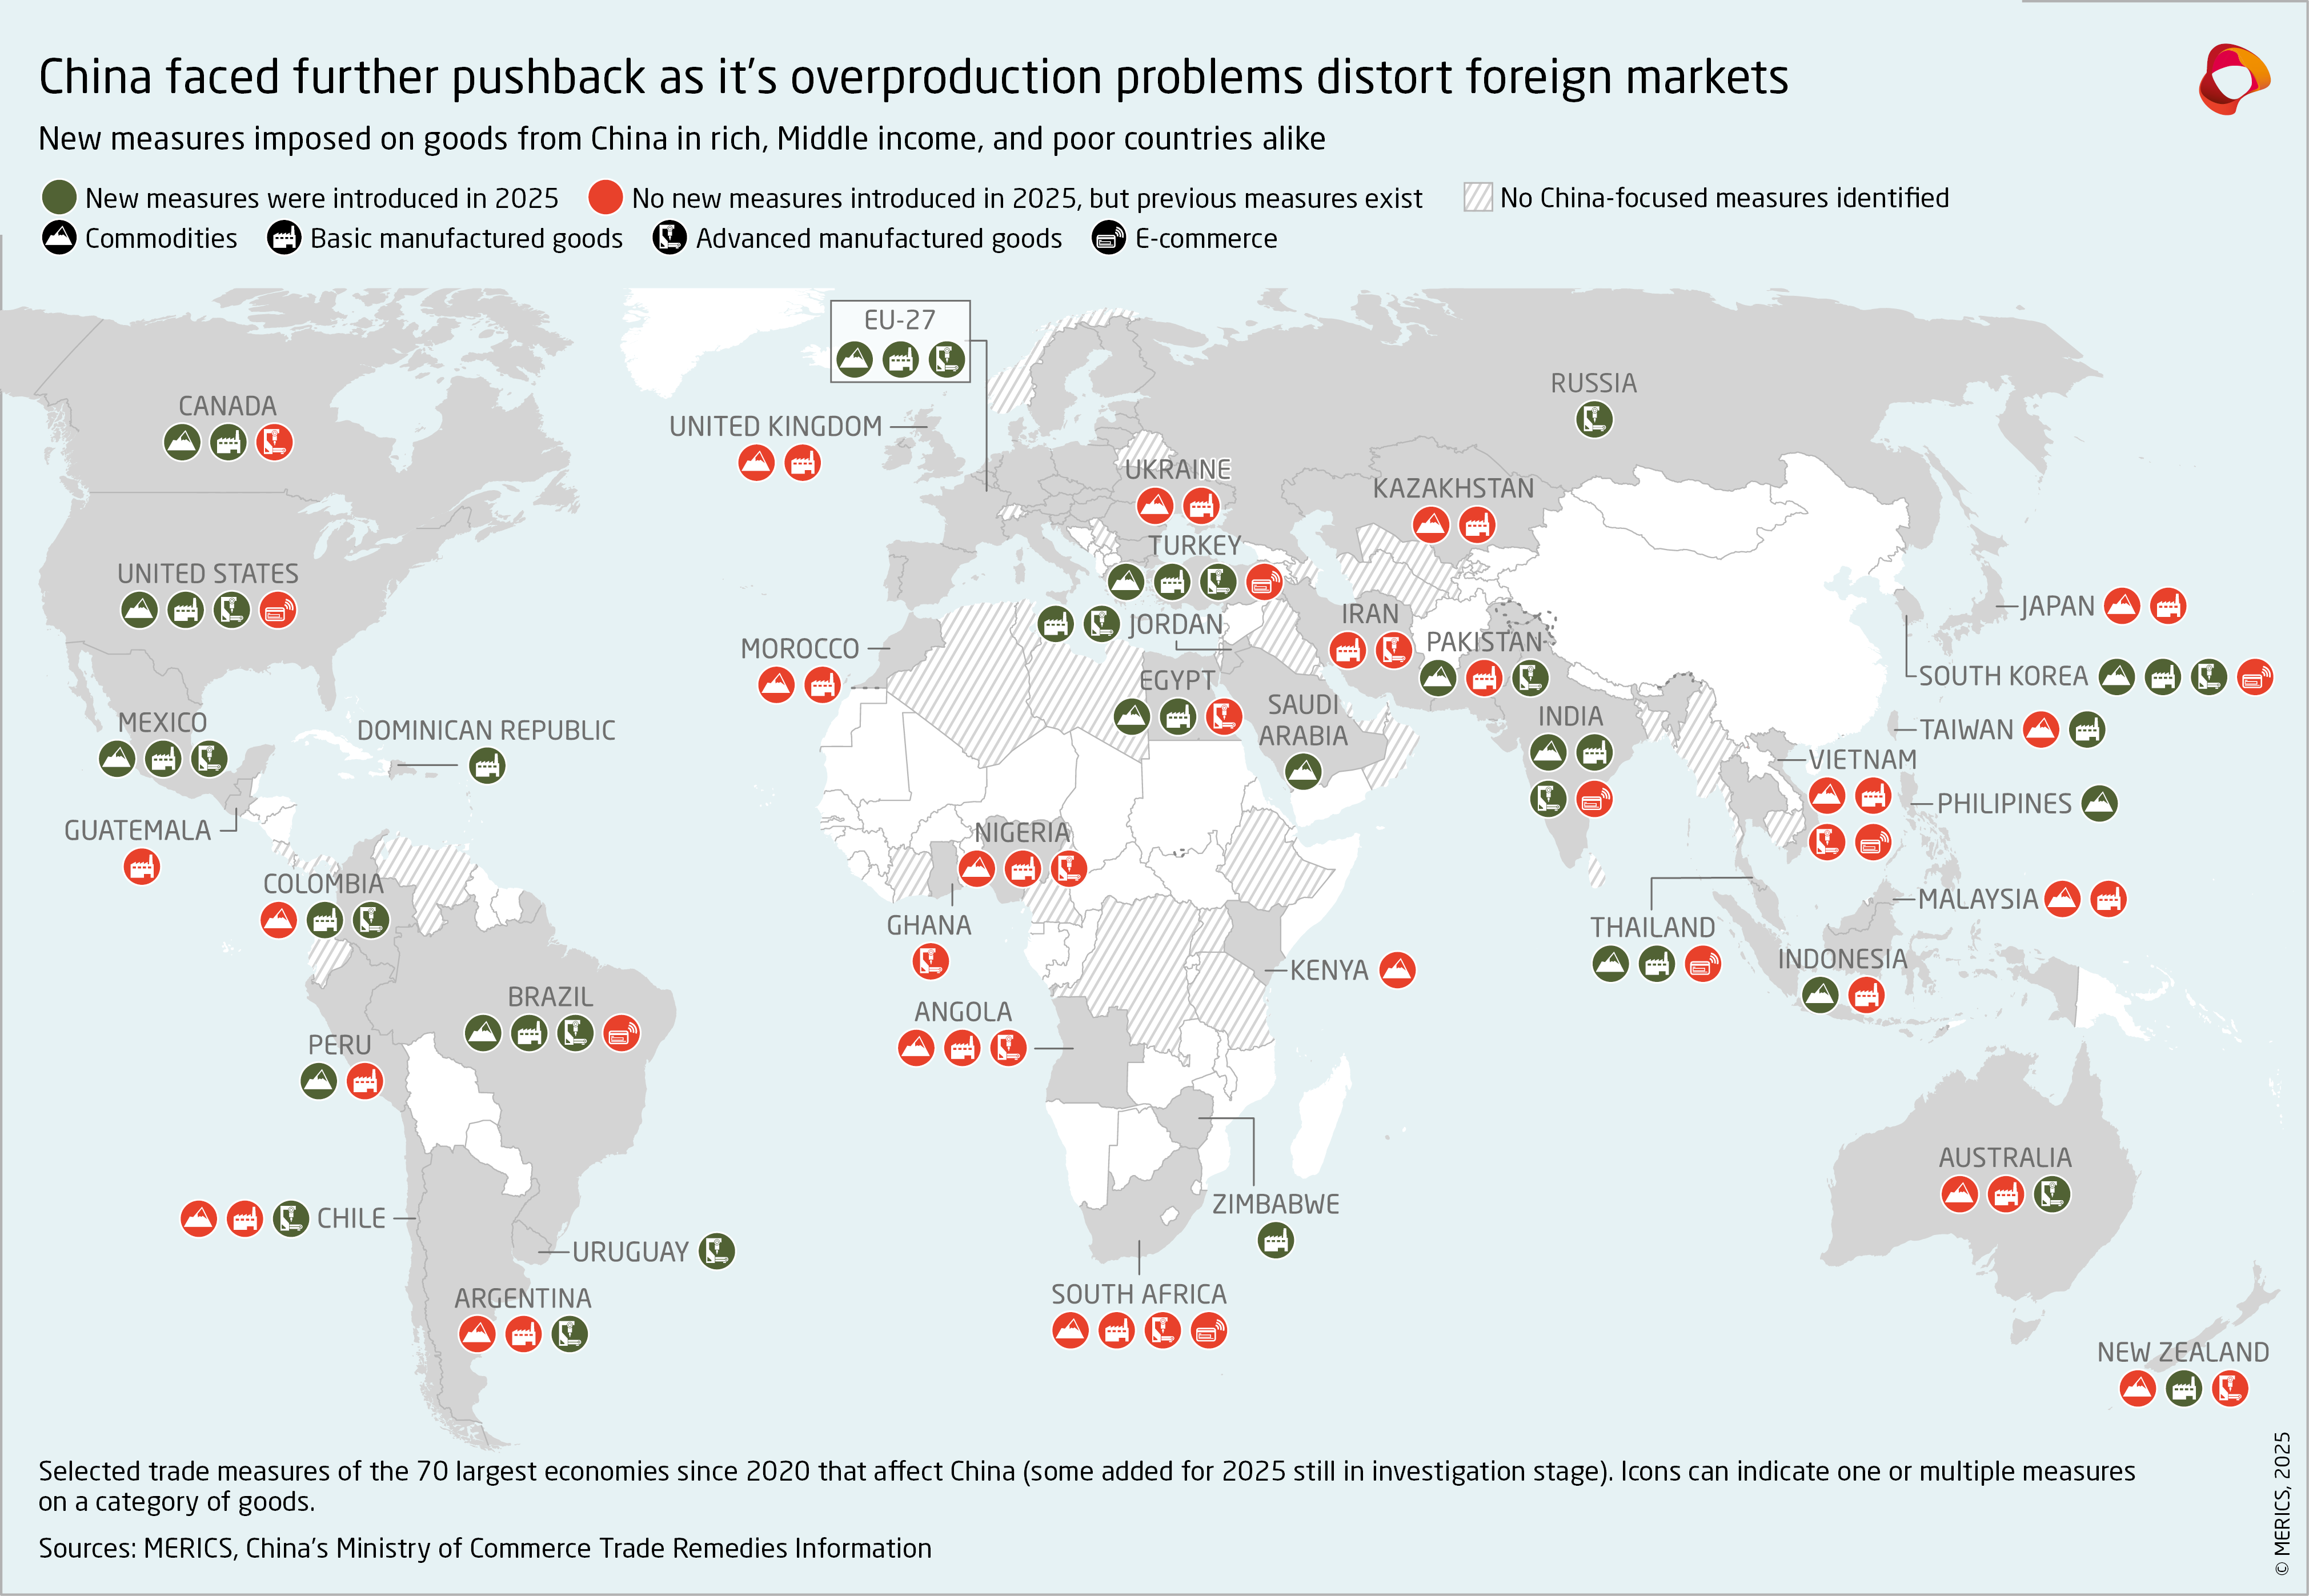
- Export of overcapacities
Regular updates will be accompanied by written analysis to keep readers up to date on developments in this area. To view the charts and their brief explanations, simply scroll down to the chart below and click on it to expand it and bring up the supporting text.
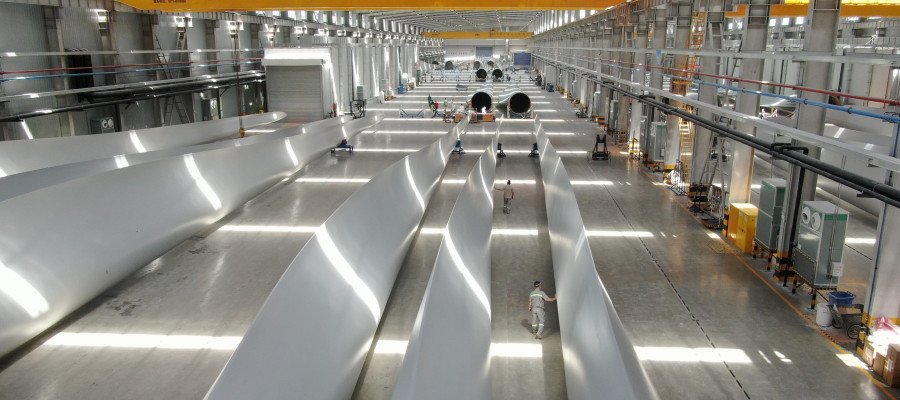
picture alliance / CFOTO
Evolution of investments

.")
.")
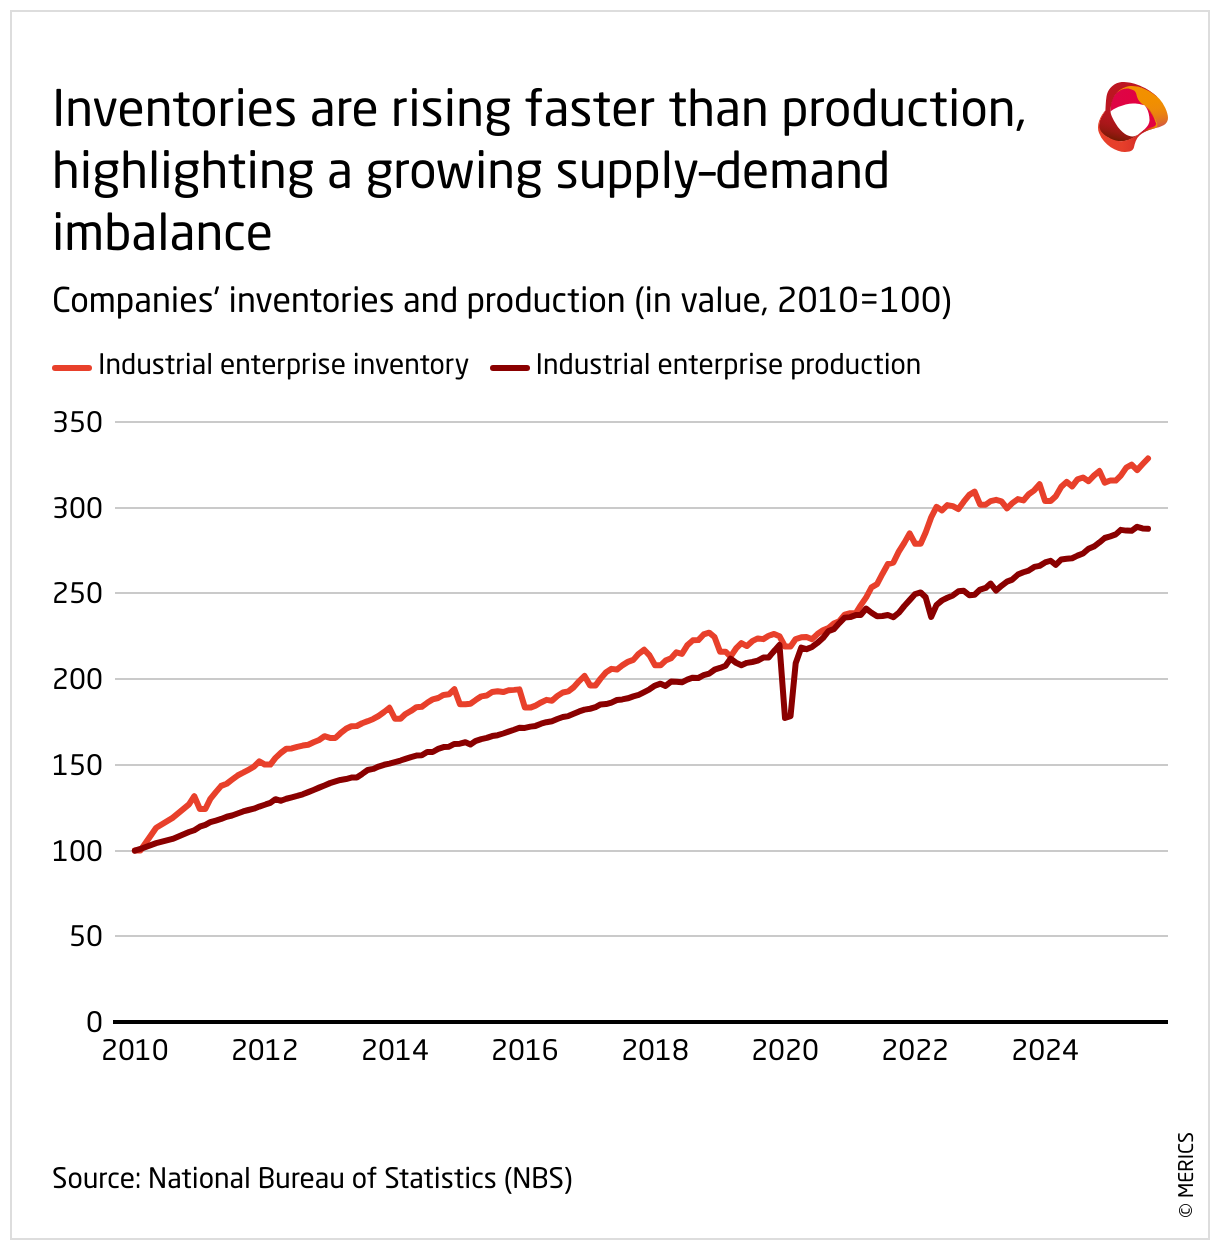
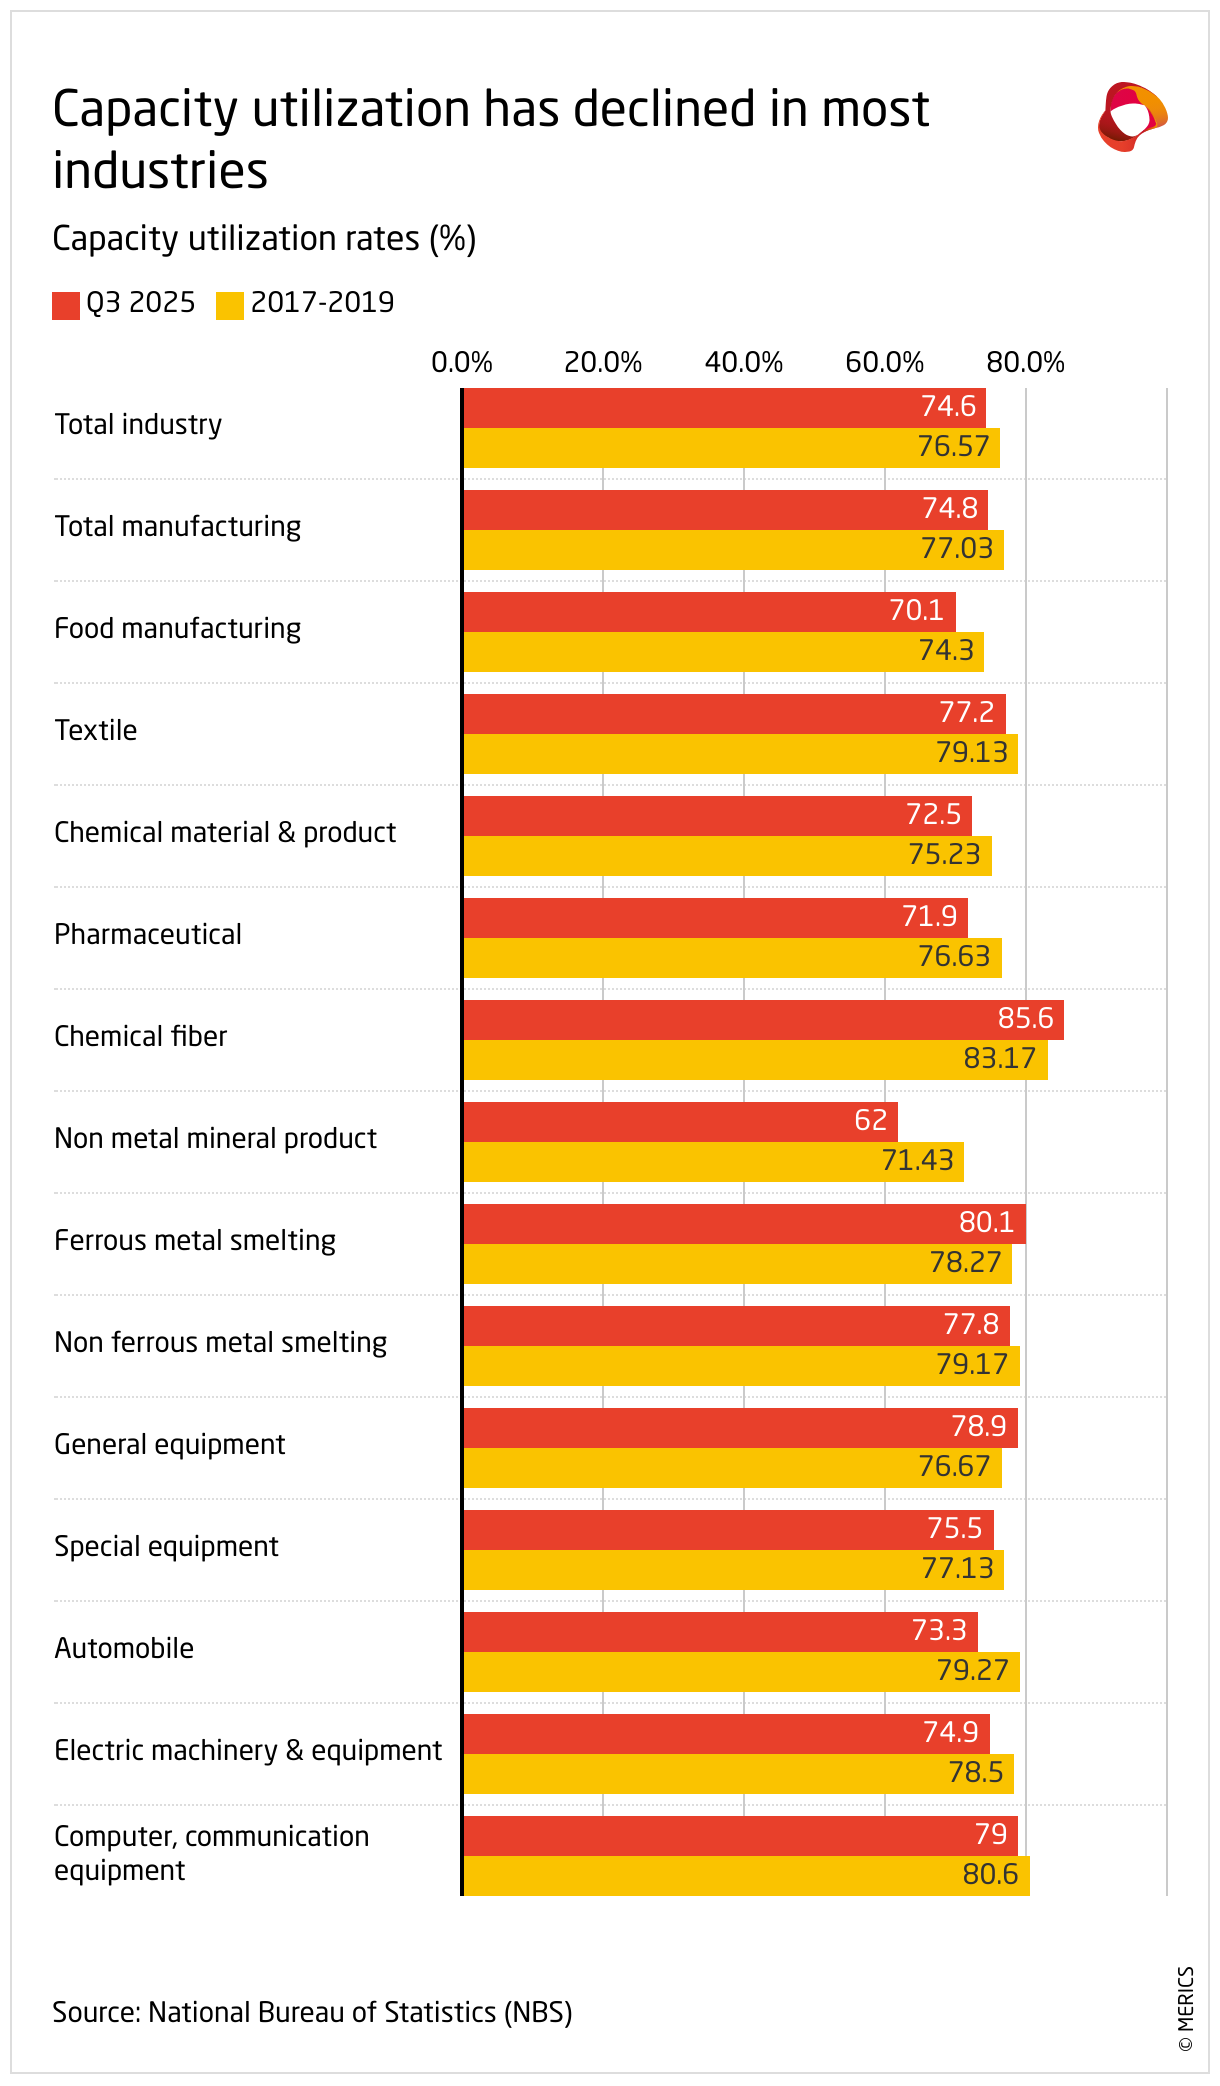
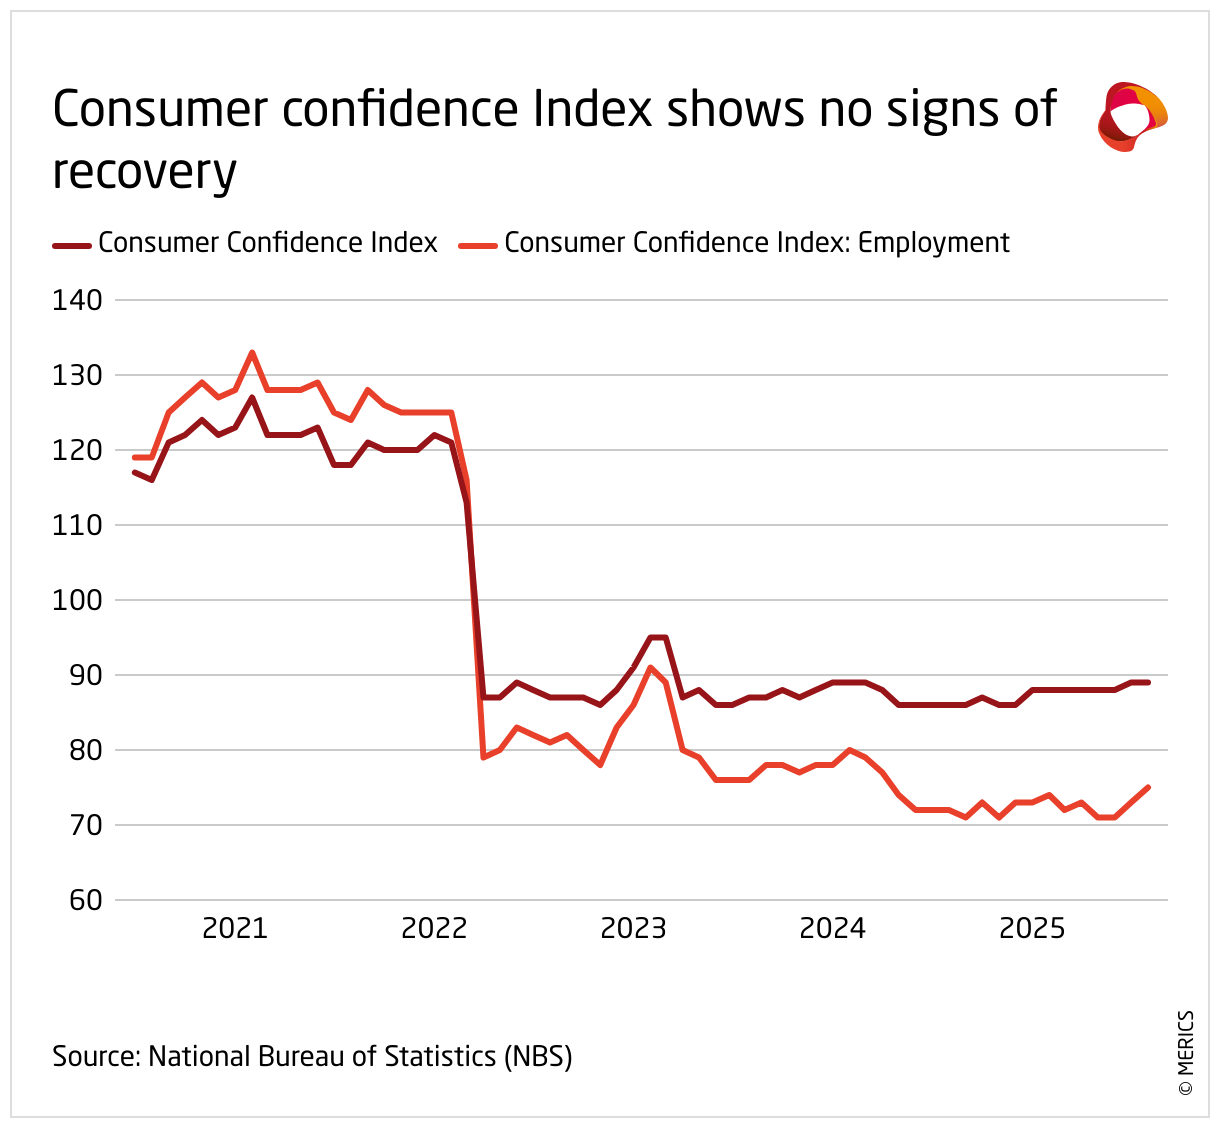
Capacity growth and consumption
.")
.")

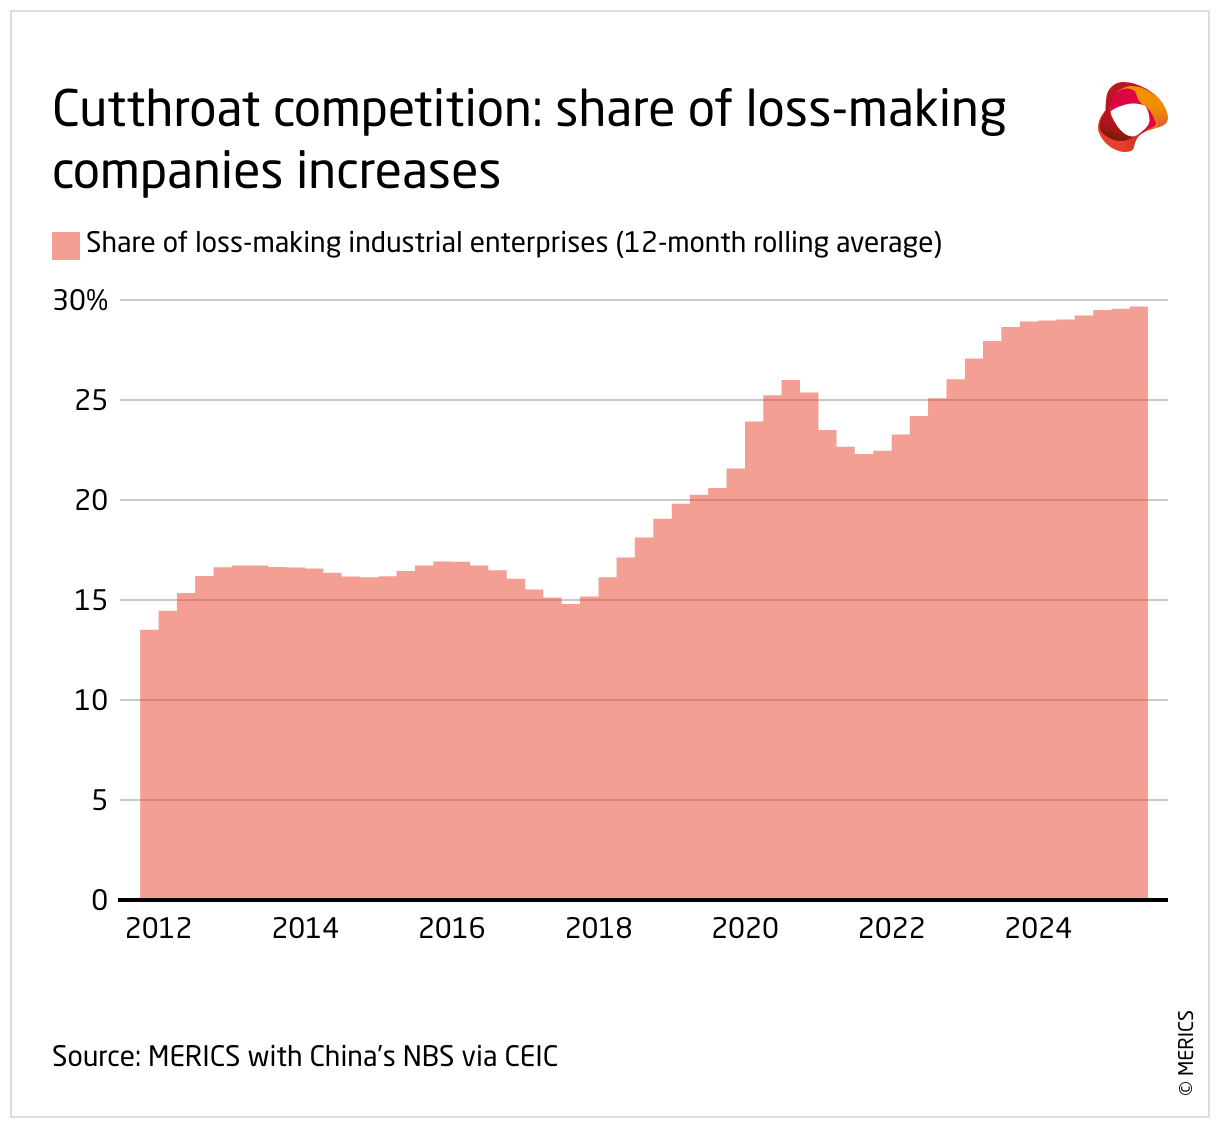
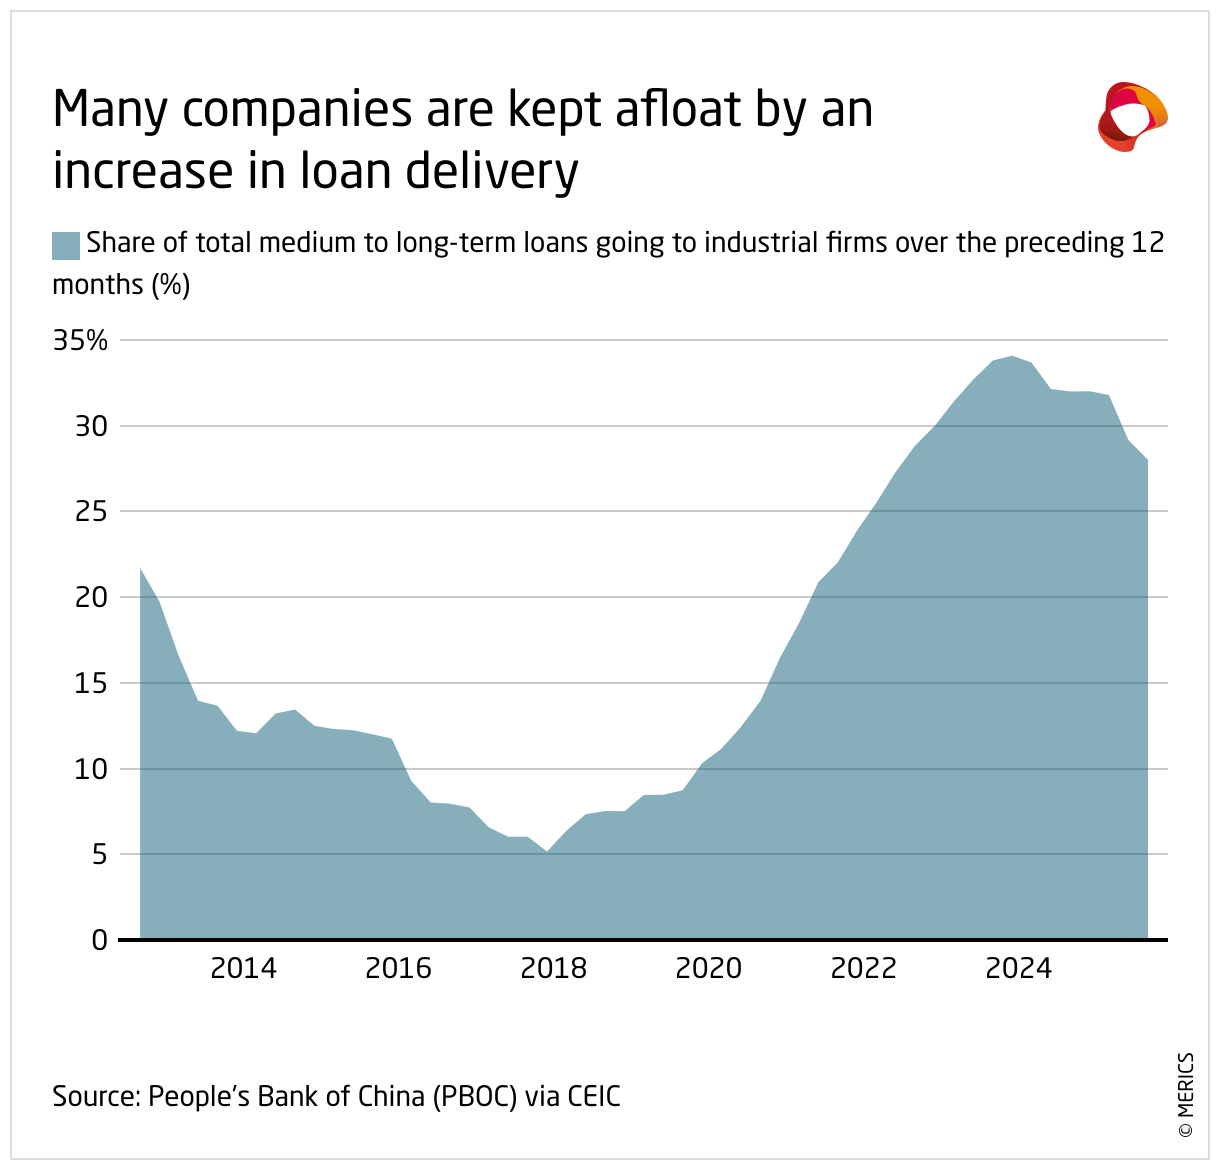
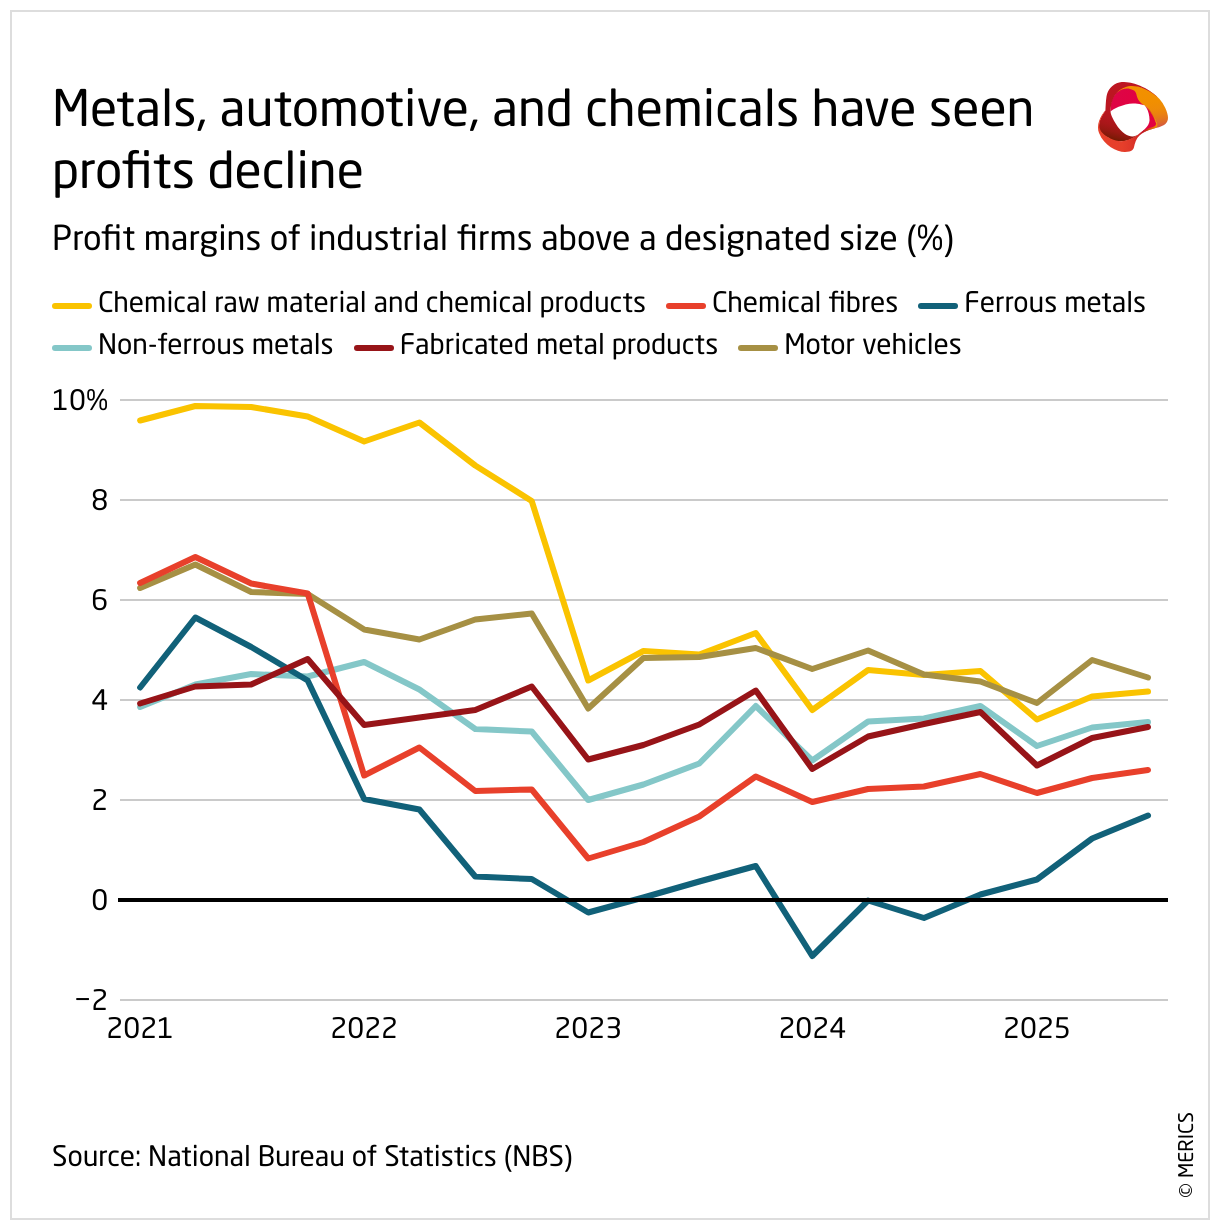
Impact on companies’ profits and losses

.")
.")
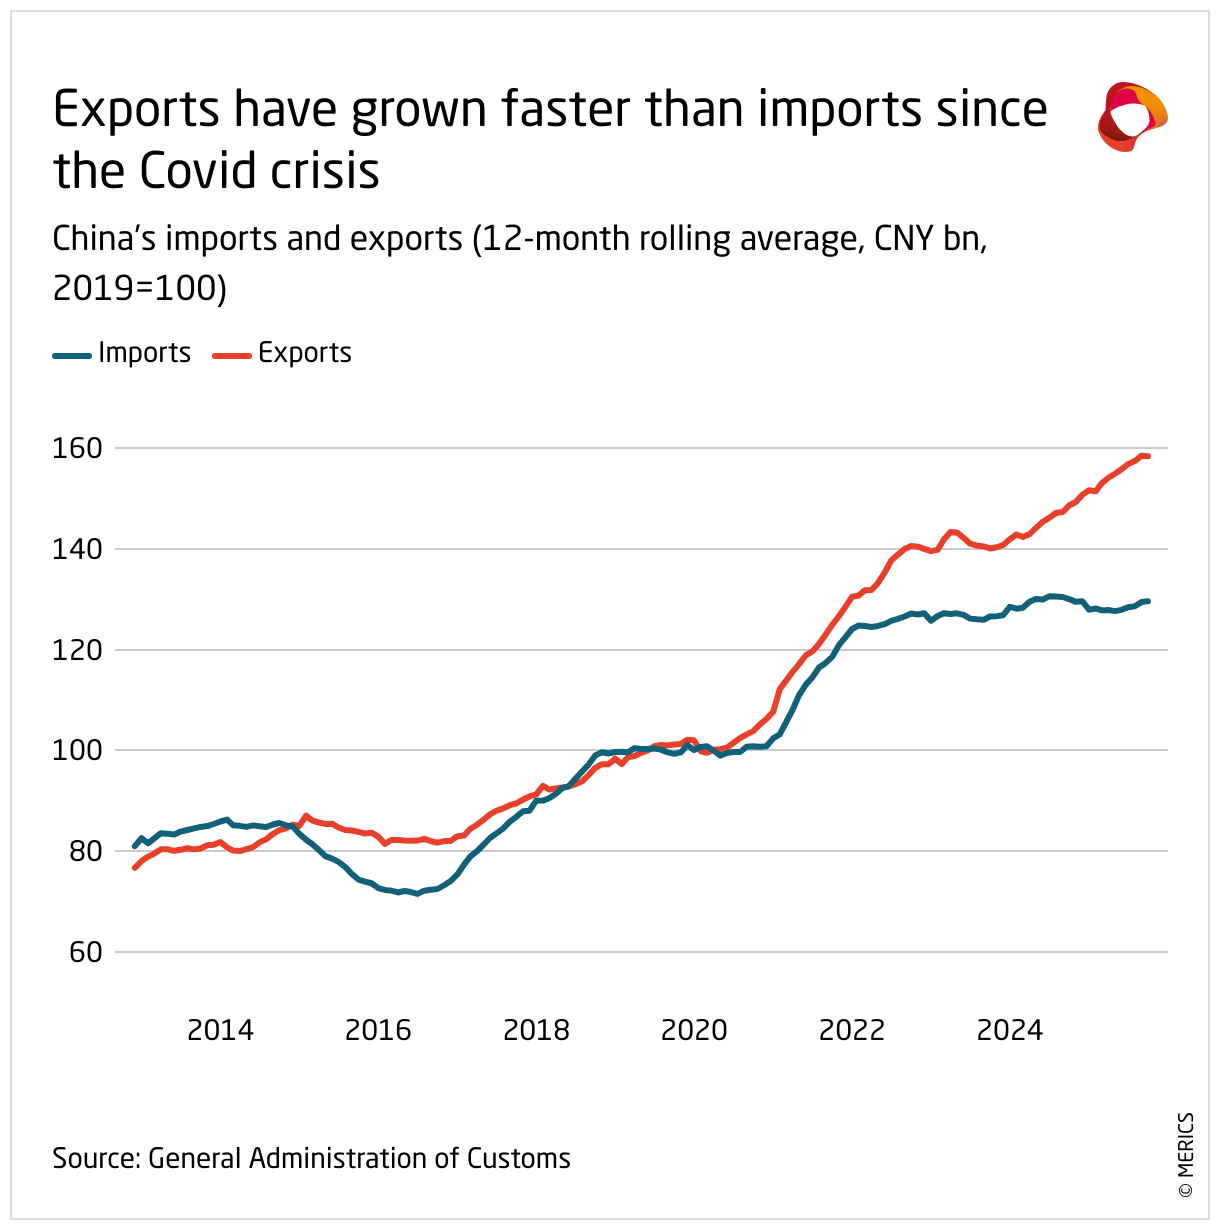
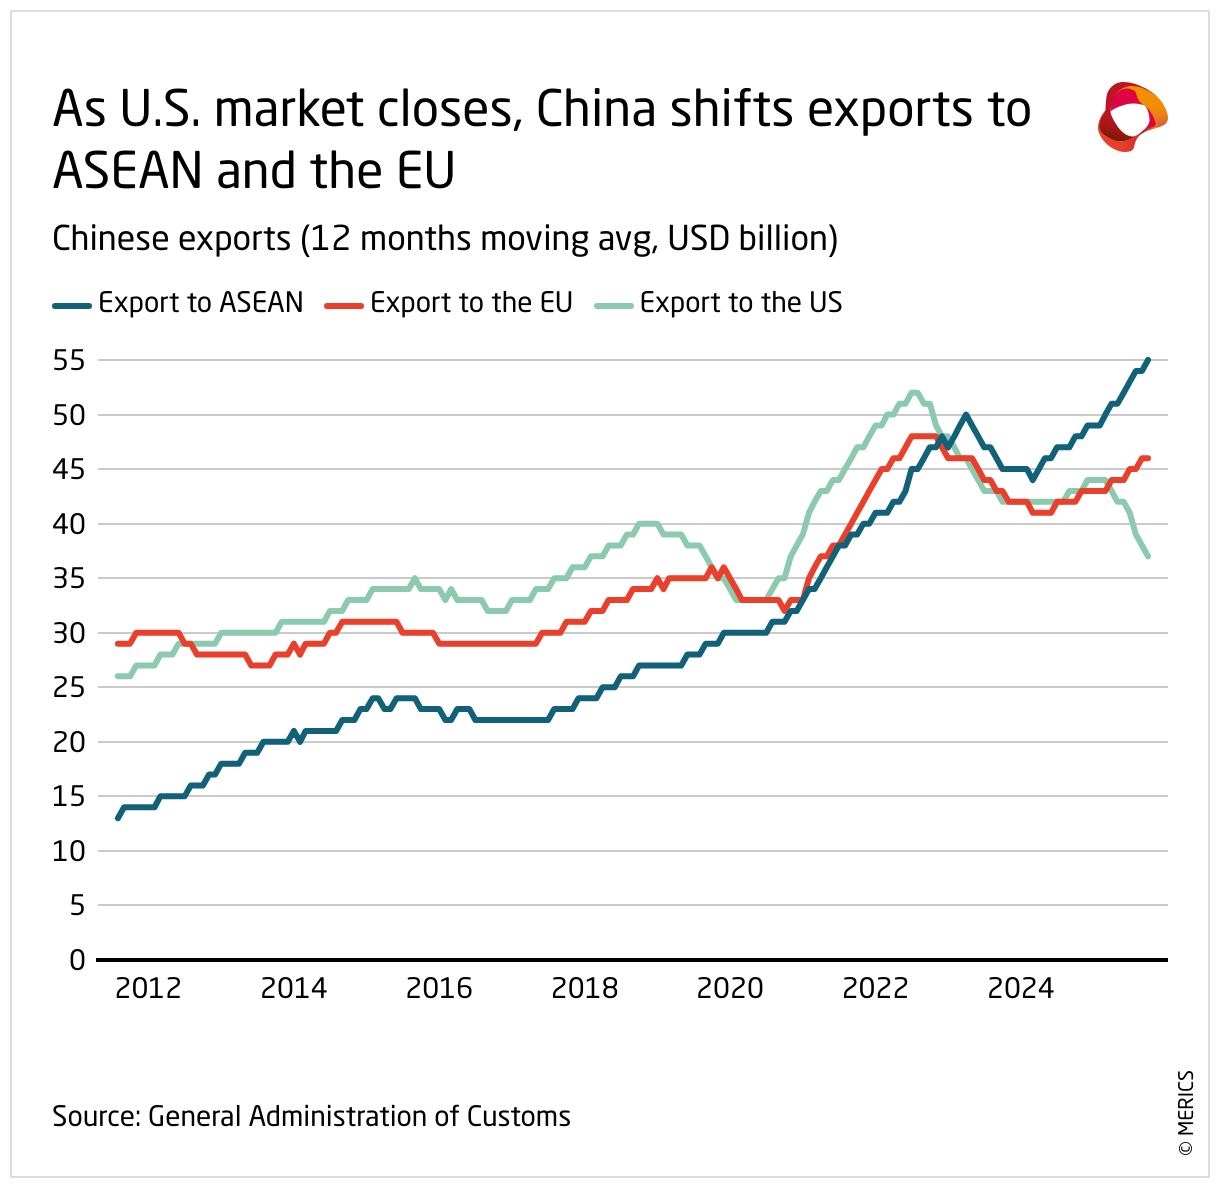
Export of overcapacities
.")
.")


Authors

Visiting Fellow

Programmleiter