China-Russia Dashboard: Facts and figures on a special relationship (Copy)
China-Russia Dashboard: Facts and figures on a special relationship
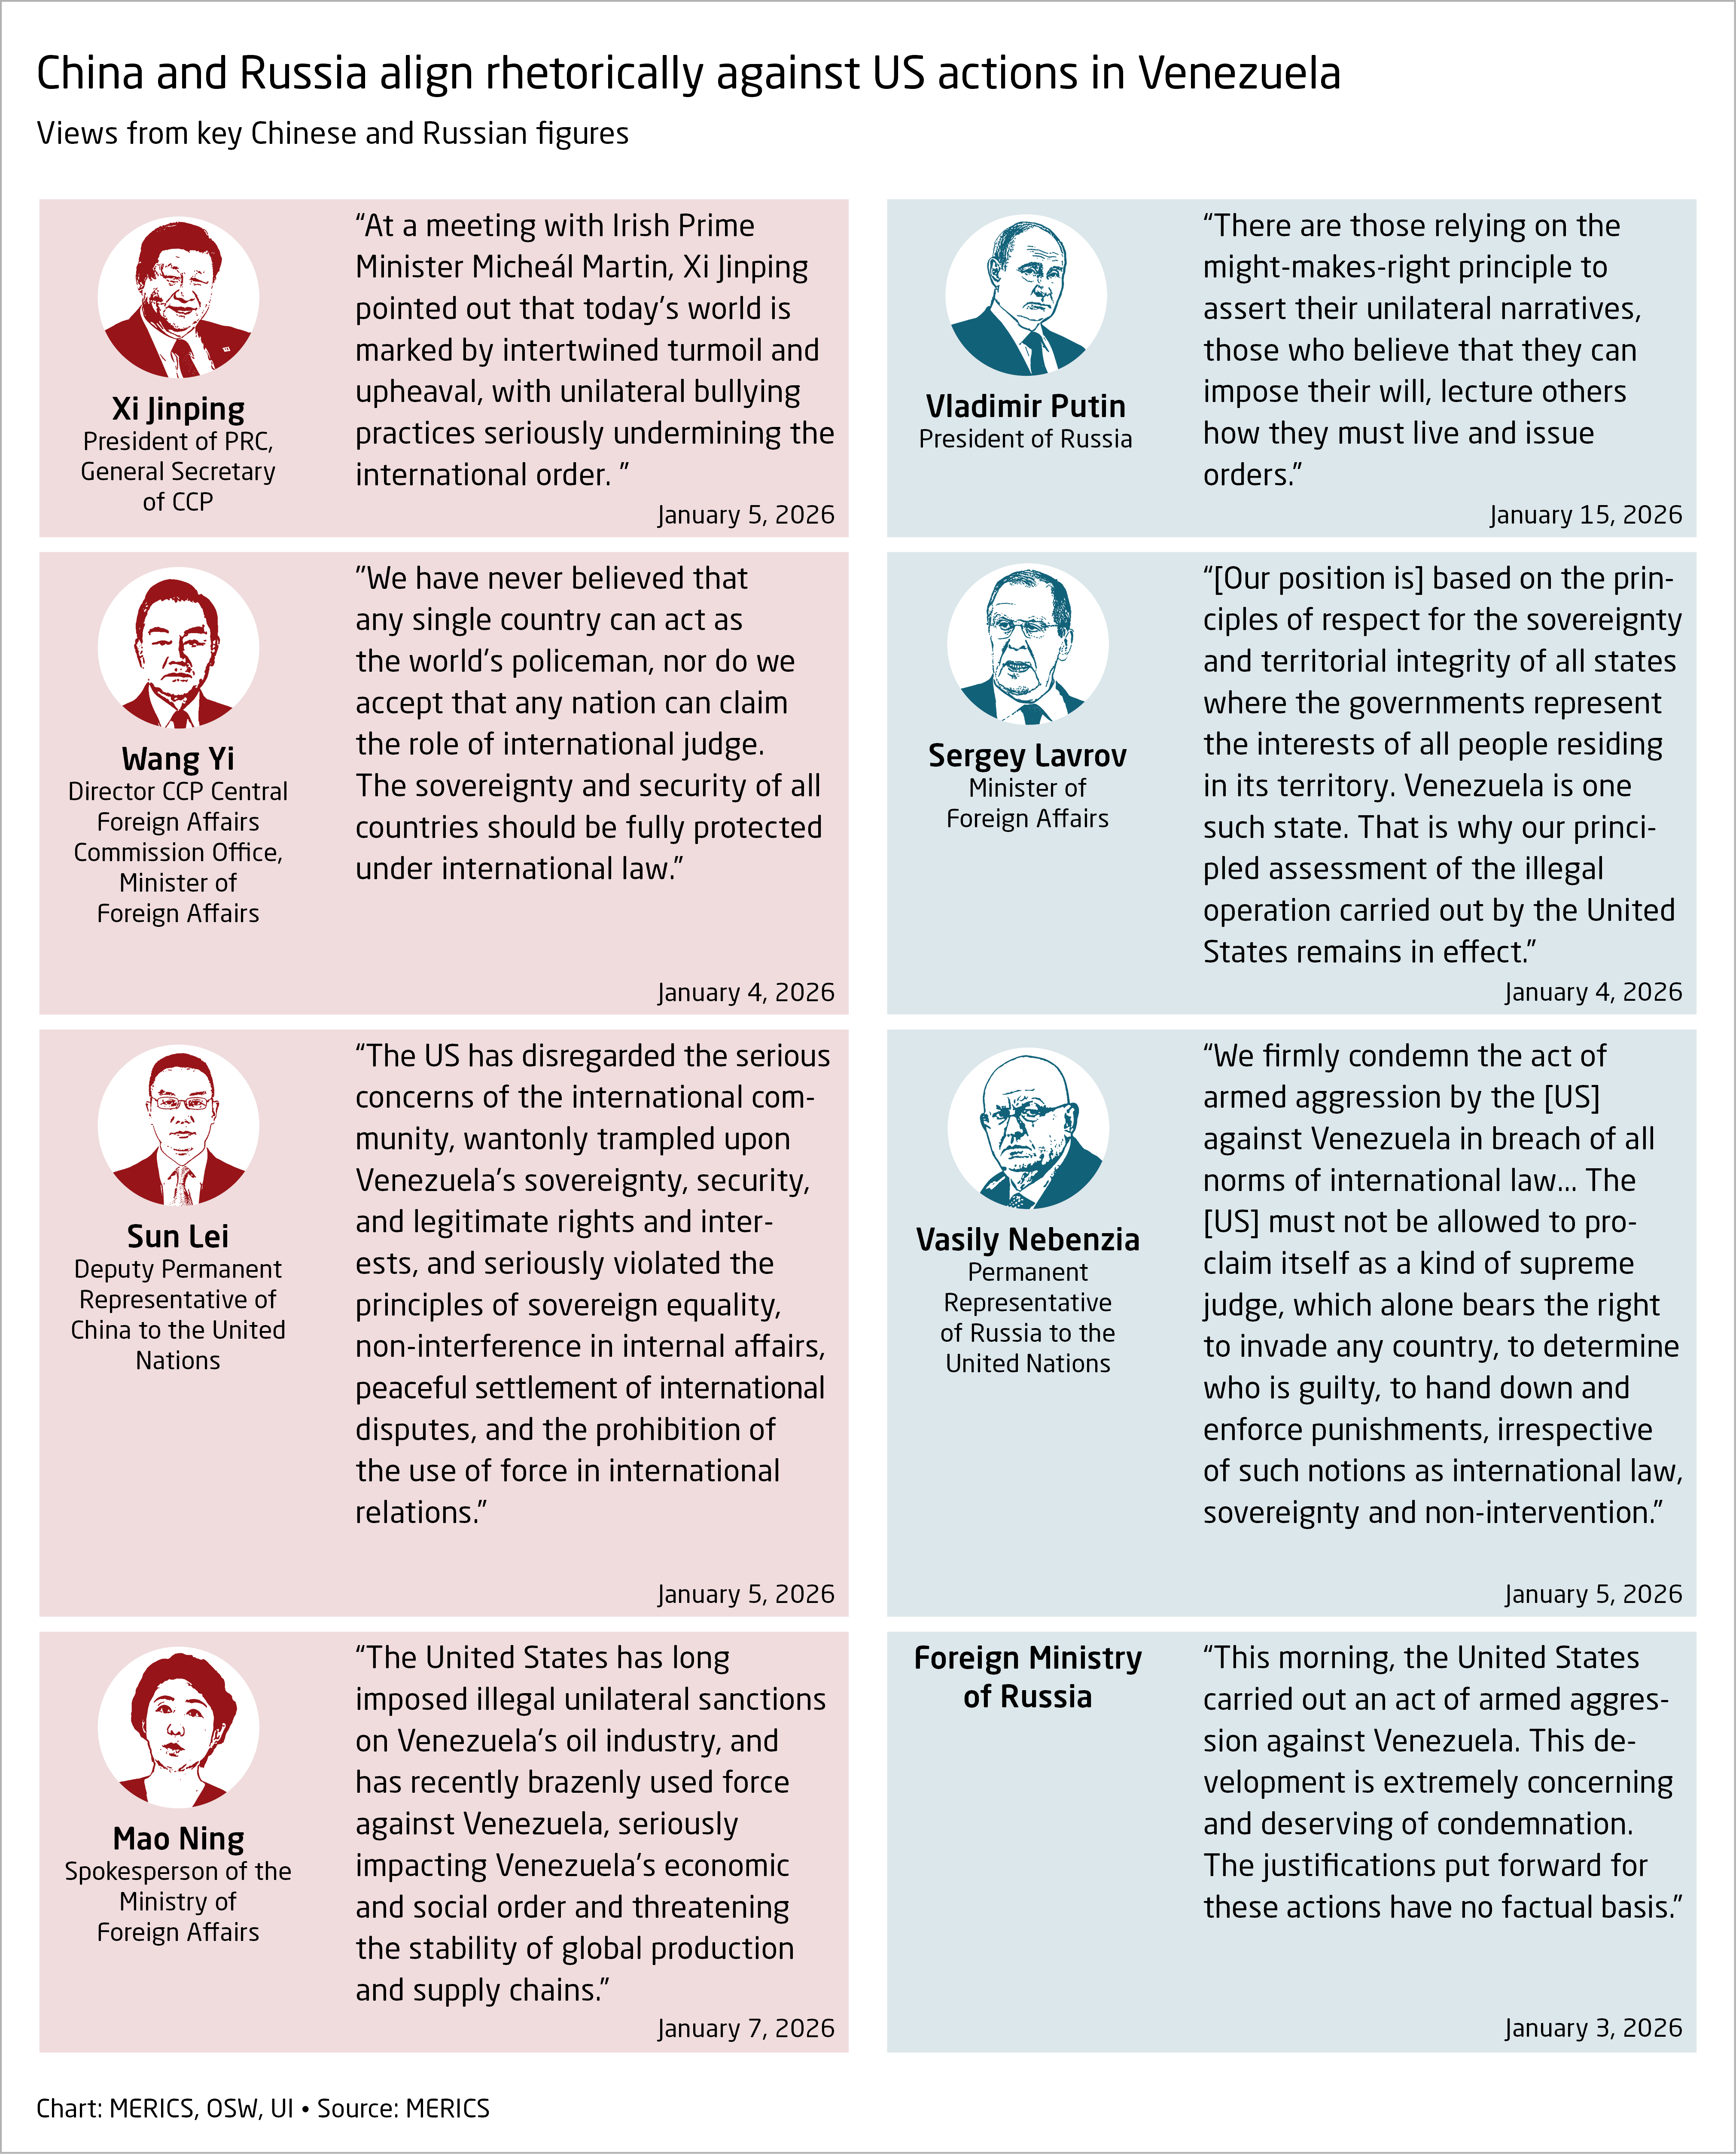
China and Russia are closer today than in decades. To help understand this relationship at a time of historic geopolitical tension, this dashboard tracks and analyzes the economic, political, security, and social dimensions of their interaction and how it changes over time. It is a collaborative research effort of the Centre for Eastern Studies (OSW), the Mercator Institute for China Studies (MERICS), and the Swedish National China Centre (NKK) and Stockholm Centre for Eastern European Studies (SCEEUS) at the Swedish Institute of International Affairs (UI).