picture alliance / ASSOCIATED PRESS | Ichiro Ohara
Tracker
China Economic Indicators
China’s economy shows first signs of stabilizing
MERICS Economic Indicators Q3/2023
Merics Q3 analysis: Government stabilization efforts bear fruits but growth outlook remains fragile
China's economy is showing the first signs of stabilization, after a lackluster post-pandemic recovery in the first half of the year. GDP expanded by 4.9 percent in Q3, and growth for the first nine months of 2023 reached 5.2 percent. Growth is likely to reach the government’s annual target of around 5 percent for 2023. However, the economy remains fragile, though it is far from crisis mode.
Over the third quarter the government shored up its efforts to stabilize the economy using targeted measures and avoiding a broader stimulus. The central bank eased monetary policy again in September by lowering the banking sector’s Reserve Requirement Ratios (RRRs) for the second time this year to pump additional liquidity into the economy. Lowering of key interest rates were limited by growing capital outflow pressure and the falling exchange rate against the US dollar. The government complemented monetary policy with announcement to boost consumption and foreign investment and promises of greater support for the private sector.
The measures helped improve sentiment as they set a baseline to ward off further deterioration. But there are limits to more support as the government is deliberately shifting to a period of lower GDP growth. The government is prioritizing steering capital and support into strengthening China’s industrial base, rather than achieving GDP growth at all costs. This reflects a strategic shift in economic policy making that is causing a painful adjustment process.
As part of the transition, the government is deliberately targeting the real estate sector. It accounts for nearly 30 percent of GDP, so the corrective polices are playing a significant role in China’s current economic weakness. The real estate slowdown is causing stress in the financial system, amid risks of defaults by major developers and diminished tax revenues for local governments. However, China’s economy is far from a financial crisis and the government is fine tuning its policies.
It has introduced some relaxations to home buying restrictions to stimulate growth and further measures are likely to be announced. However, these adjustments do not mark a course correction to appease consumers. Downsizing the real estate sector is hurting the middle classes’ primary asset class, making it a major cause of economic insecurity. Add a lackluster labor market and it is easy to see why consumer sentiment is weak and any recovery in consumption remains slow despite some signs of improvement over the last quarter. So far, the government seems to be hoping current measures will be enough, as specific measures targeting households have been sparse.
The government has signaled its commitment to reform and opening in an effort to reassure consumers and companies alike and send strong messaging ahead of the party’s Third Plenum. China’s economic weakness is causing unease but is not strong enough to warrant a significant change in policy priorities. Looking ahead, this means stimulus measures are likely to remain targeted and restrained and the growth outlook for the coming quarters will be relatively weak.
![]() Hover over/tap the chart to see more details.
Hover over/tap the chart to see more details.
Exhibit 1
The MERICS China Confidence Index (MCCI)
The MERICS China Confidence Index measures household and business confidence in future income and revenues. The index is weighted between household and business indicators. It includes the following indicators: stock market turnover, future income confidence, international air travel, new manufacturing orders, new business in the service sector, urban households’ house purchase plans, venture capital investments, private fixed asset investments and disposable income as a share of household consumption. All components have been tested for trends and seasonality.
The MCCI was first developed in Q1 2017.
Macroeconomics: China’s economy stabilizes and beats forecasts in Q3
Exhibit 2
![]() Hover over/tap the chart to see more details.
Hover over/tap the chart to see more details.
Exhibit 3
- The improving economy in the third quarter shows the government’s stabilization measures over the last few months are beginning to take effect. The government’s aim is to ensure that future growth is driven by sectors which support national strategic goals, meaning more (upgraded) manufacturing and less real estate.
- China’s economy expanded by 4.9 percent, beating market expectations of 4.4 percent growth. Growth slowed from 6.3 percent Q2 this year due to base effects. But stronger quarter on quarter growth shows the economy is regaining some momentum (see exhibit 2).
- Growth in the first nine months of 2023 was 5.2 percent, in line with the government’s target of around 5 percent. The government is likely to be comfortable with this level of growth, as it is deliberately accepting lower GDP growth during the transition phase towards an economic model that prioritizes technology and manufacturing.
- Reflecting the ongoing shifts, the real estate sector dragged down growth, shrinking by 2.7 percent in Q3 year on year. Growth in strategically approved sectors, including manufacturing and IT, was considerably stronger (see exhibit 3).
- China’s economy still faces a challenging external environment with growing geopolitical risks and insufficient demand. Stabilization efforts, particularly for the property and financial markets, will continue to be critical to shore up growth further.
What to watch: Stabilization remains fragile but stimulus measures will remain targeted only.
Business: China's industrial production remains robust in Q3
Exhibit 4
![]() Hover over/tap the chart to see more details.
Hover over/tap the chart to see more details.
Exhibit 5
- Industrial production remained steady in Q3, exceeding market expectations. Value-added growth expanded by 4.5 percent in both August and September, slightly up from 4.4 percent at the end of Q2. But weak ex-ternal and domestic demand risks pushing growth lower in the coming months.
- The manufacturing sector produced the major share of growth, with 5 percent growth in September, compared to 1.5 percent for the mining sector. Momentum was particularly strong in the chemical, metal and automotive sectors (see exhibit 4). The automotive industry’s ongoing strong output is underpinned by demand for NEVs, where output grew by 12.5 percent in September.
- The lack of new investment in real estate and infrastructure was reflected in declines in concrete and plated glass, which contracted by 7.2 and 6.0 percent respectively. Year-to-date growth figures for these products are both below zero: concrete has contracted by 0.7 percent and plated glass by 7.4 percent.
- In high-tech manufacturing, value-added output grew by only 2.3 percent in September year on year. Pharmaceutical output contracted by 7.7 percent in September. Some high-tech products seem to have plateaued after very high double-digit growth during 2020 and 2021. For example, in September the industrial robot sector was down by 14.3 and micro-computer equipment contracted by 16.3 percent.
- China’s official Manufacturing Purchasing Managers’ Index (PMI) crept back into optimistic territory as it rose above 50 (the benchmark for positive sentiment) for the first time since March, reaching 50.2 in September. Government promises to ease business conditions for private firms may have produced cautious optimism among manufacturers. But business owners in the service sector are growing more pessimistic. The Caixin Services PMI has been trending down since March and finished at 50.2 percent in September.
What to watch: Industrial output growth rates will rise in Q4 2023 and Q1 2024 due to base effects from comparison with the tail-end of Covid lockdowns. After that, production growth is likely to stabilize below pre-pandemic levels.
International trade and investment: Trade figures improve slightly in Q3 but remain weak
Exhibit 6
![]() Hover over/tap the chart to see more details.
Hover over/tap the chart to see more details.
Exhibit 7
- China’s exporters faced a weak global and domestic economic environment in Q3. China’s exports on a USD basis declined by 5.7 percent in the first three quarters of 2023, and imports contracted by 7.5 percent over the same nine-month period. In Q3, trade showed signs of improvement after their low point in July, they continued to contract in part due to currency effects (see exhibit 6).
- The trade surplus reached 630 billion USD in the first three quarters, slightly below the 631 billion USD recorded the same period of 2022 — the year when China achieved its largest-ever surplus. Trade imbalances have widened following the pandemic export boom; China’s monthly surplus is now more than double the three-year period averages of the pre-pandemic era.
- Trade has been falling with all major trading partners. In the first nine months of this year, trade growth (import and export) with the United States fell by 14 percent; it was down 7.7 percent with the EU; and 5.5 percent with ASEAN. Russia is a notable exception as trade has expanded by 29.5 percent since January, lifted by exports surging by 56.9 percent.
- Imported quantities of commodities including iron ore and coal have been rising in preparation for the winter heating season and (potentially) more construction. In the first nine months until September this helped lift imports from Australia (up 8.1 percent), Canada (17.6 percent) and Brazil (4.4 percent).
- Conversely, the weakened electronics cycle impacted trade with Taiwan and South Korea, major semiconductor and component suppliers to China’s manufacturing sector. Imports from Taiwan had declined by 20 percent and from South Korea by 23 percent by the end of September.
- Automobiles remain a bright spot for China’s exports and are an indication of shifting trade patterns towards more high value goods (see exhibit 7). Backed by the ongoing internationalization policy for Chinese EVs and by support from Tesla and European brands, auto exports have surged by 83.9 percent so far this year while imports slumped by 12.6 percent.
What to watch: The EU’s recently launched probe into China’s EV subsidies may bring fresh trade frictions.
Financial markets: Monetary policy must juggle stimulus and depreciation pressure
- The People’s Bank of China (PBOC) is facing a difficult situation: it must restore sentiment in the economy while retaining the debt risk control measures from the deleveraging campaign. It must also prevent financial contagion from a tumbling real estate sector and deal with capital outflow pressure.
- The real-estate slowdown is sending shockwaves through financial markets. Major real estate developers including Country Garden and Evergrande are on the brink of default. The risks extend to highly exposed smaller banks. Runs on smaller banks have been reported, reflecting the uncertainty.
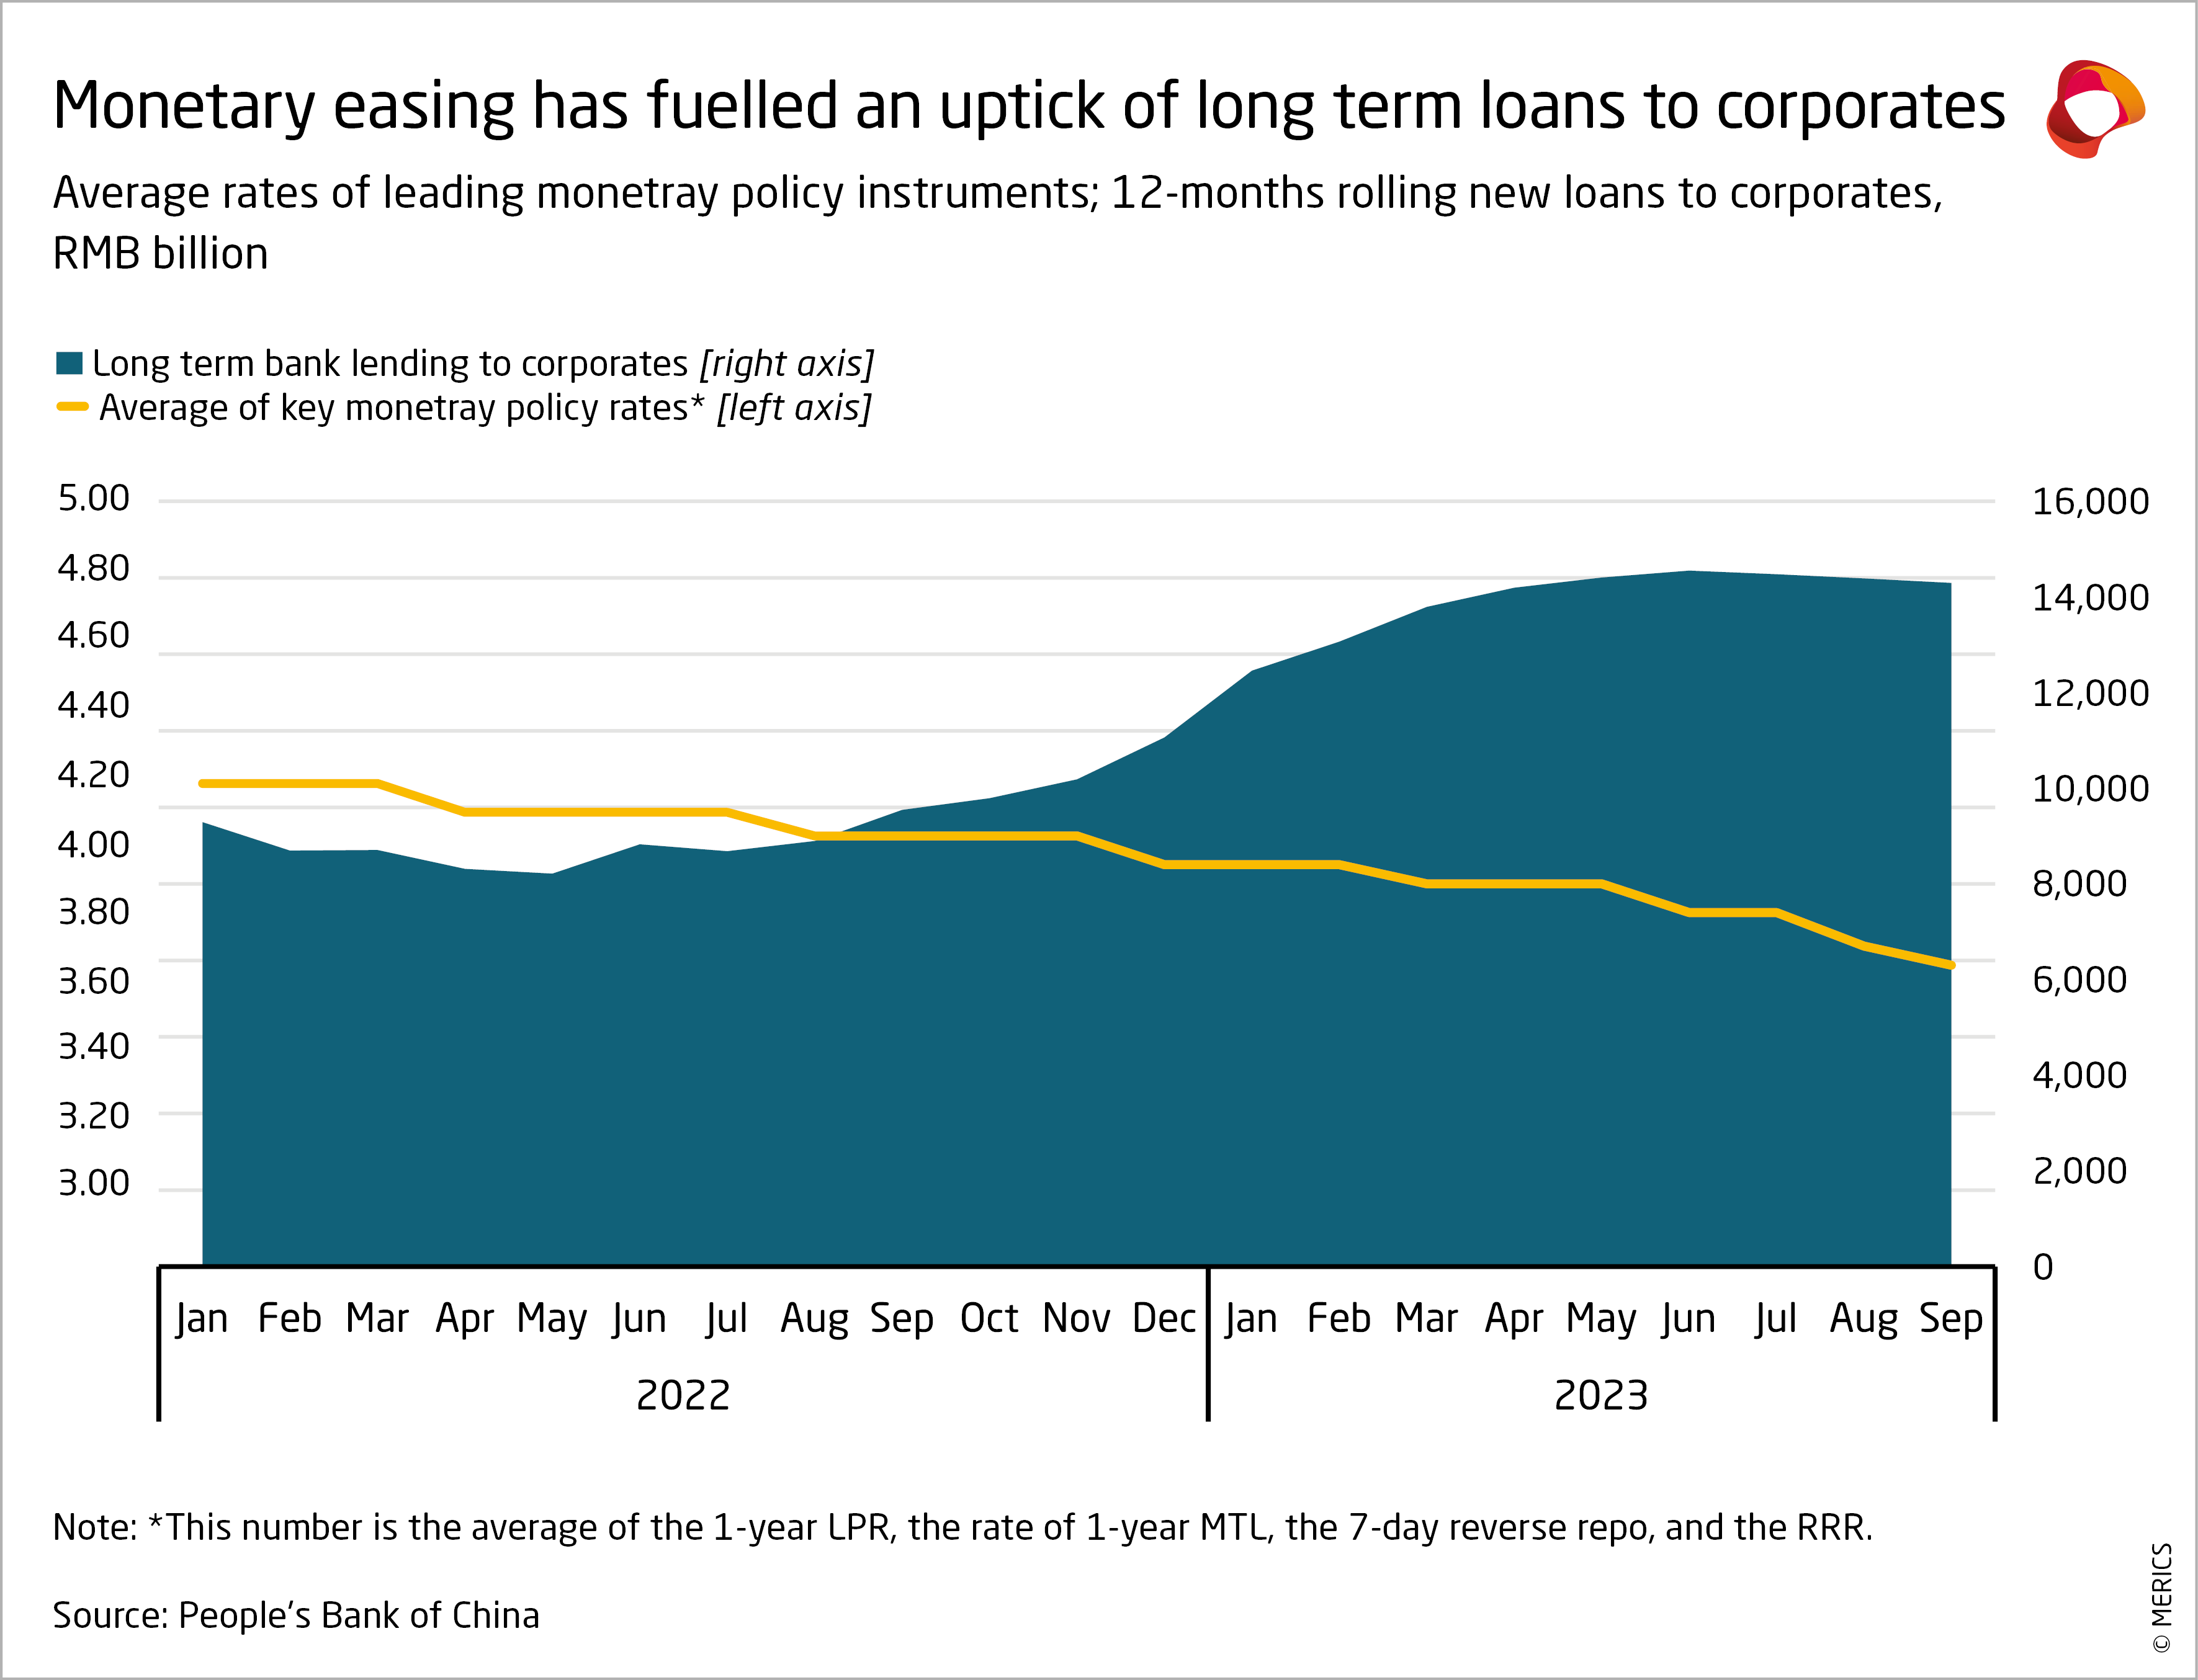
- Total social financing to the economy remained relatively stable. It rose by 9 percent in September year on year which was a small slowdown compared to 9.3 percent growth at the end of Q2. Government bonds and long-term corporate loans – most likely state-owned ones – helped compensate a for 48 percent drop in corporate short-term lending in Q3 compared to the same July to September period last year (see exhibit 8).
- Beijing has further increased its monetary support to help stabilize the economy. In September, the banking sector’s required reserve ratio (RRR) was lowered for the second time this year. The 25-point reduction injected an estimated CNY 500 billion into the financial system. It came after a key interest rate for corporate loans was cut: the one-year loan prime rate was reduced in August from 3.55 percent to 3.45. In September, major banks also announced lower mortgage rates for first-time home buyers.
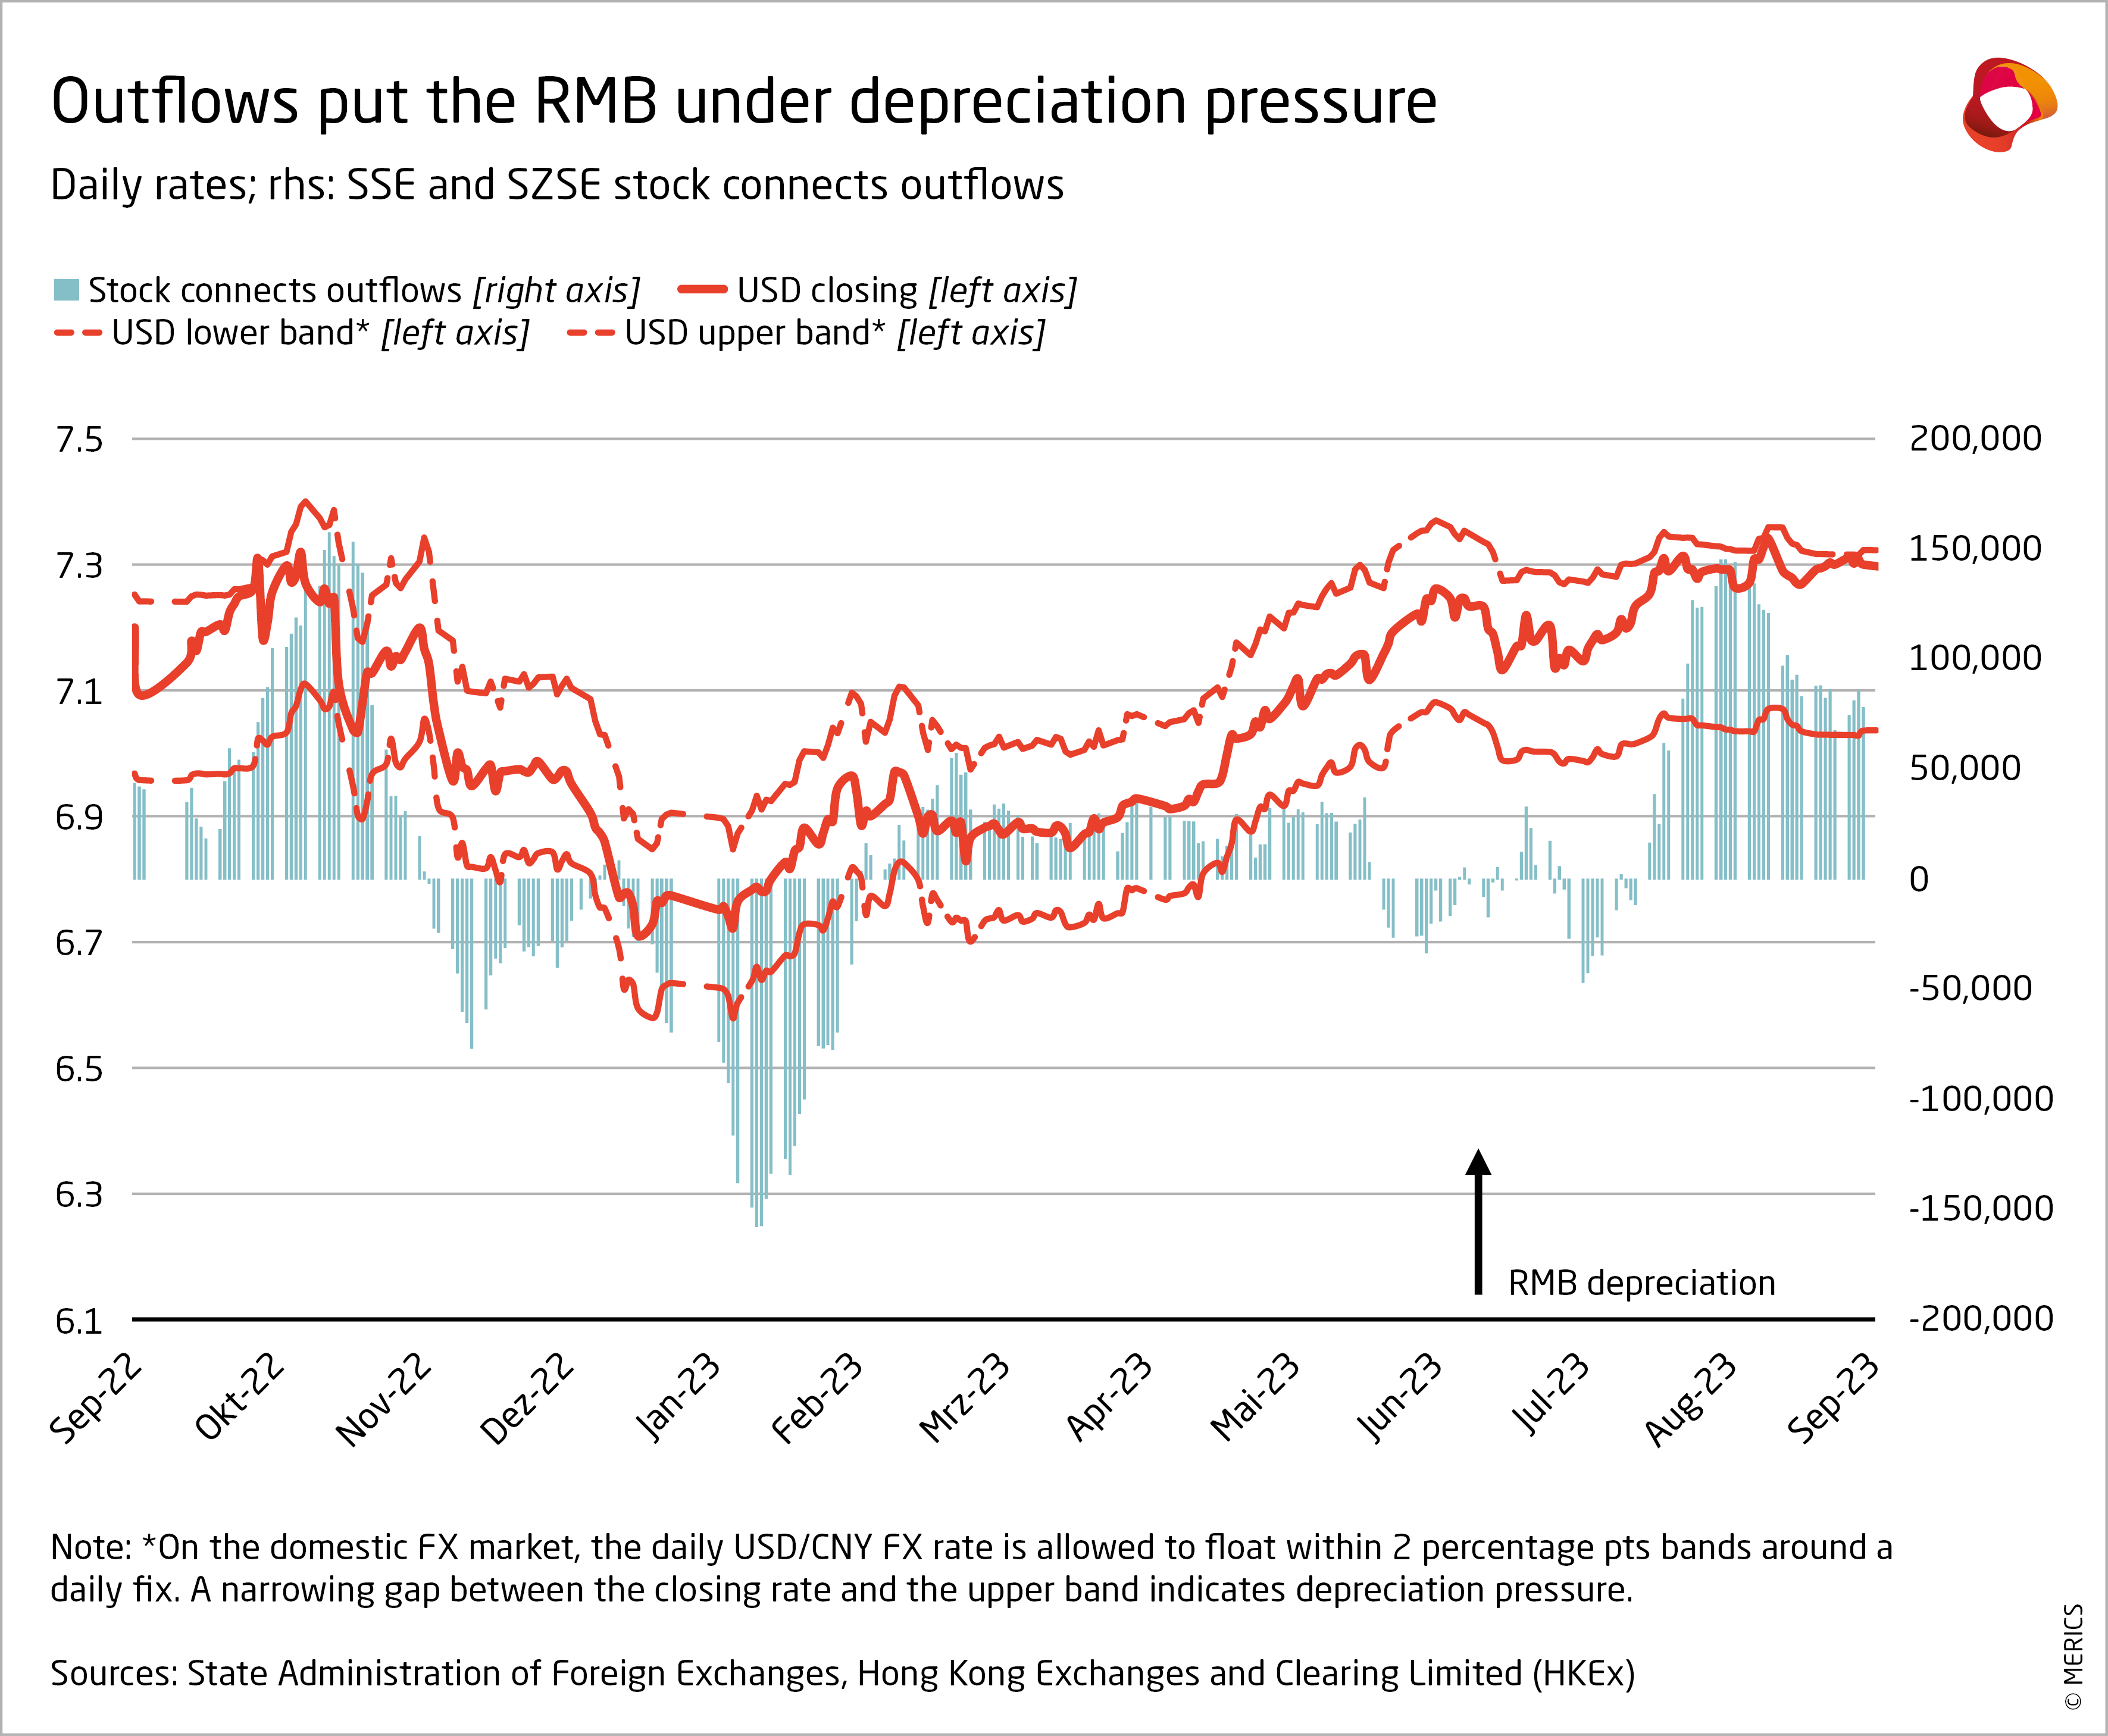
- But there are limits to how low interest rates can go as higher US interest rates are stoking capital outflow pressures in China. Outflows from the stock and the bond markets have reappeared, after a short-lived pause in Q2. Outflows have contributed to a 5 percent depreciation in the yuan versus the US dollar over 2023 (see exhibit 9). Beijing has mobilized its anti-depreciation toolbox. The most likely measures include selling off US Treasuries to support the yuan, which fell to a 14-year low in July.
What to watch: Stronger growth in household credit would indicate an improvement in sentiment.
Investment: Investment growth falls amid structural shift away from real estate
Exhibit 10
![]() Hover over/tap the chart to see more details.
Hover over/tap the chart to see more details.
Exhibit 11
- Investment continued to trend downwards, a sign of the government’s restraint in using stimulus and its commitment to shift China’s growth model away from real estate toward manufacturing. Year-to-date investment growth finished at 3.1 percent in September. This is well below pre-pandemic investment levels, which averaged 6.2 percent between 2017-2019, and close to the 2.9 percent seen in 2020, which was the lowest recorded full year figure.
- In real estate and infrastructure, limited or negative investment dragged down overall investment growth. The government continues to shun these sectors, the mainstays of its old stimulus playbook. Year-to-date investment in real estate sector had contracted by 7.5 percent by the end of August. Although officials want to put a floor under the sector’s decline, there will not be a significant uptick. Similarly, infrastructure investment growth fell from 7.2 percent to 6.2 percent between June and September.
- However, the leadership’s efforts to strengthen industry are paying dividends. Investment in manufacturing remained robust in Q3, rising from 6 percent in H1 to 6.2 percent by the end of September. The key sectors driving growth were automotive, electrical machinery and equipment, and chemicals (see exhibit 10).
- Private sector investment turned negative in May and is now firmly in the red; it had shrunk by 0.6 percent by the end of September. But this was primarily due to contractions at private firms in the primary and tertiary sectors. Those in manufacturing saw investments grow by 9 percent through to the end of September.
- To attract more foreign investment, Beijing has increased its engagement with foreign business and released a string of supportive policies. The State Council issued 24 measures in August. Regulations relaxing restrictions on data exports followed in September. The impact from these moves (if any) will take time to materialize. Foreign investment growth trended downwards in Q3, finishing at 1.7 percent.
What to watch: China’s transition away from real estate and infrastructure to manufacturing means its old supports will continue to dent overall growth as they adjust to lower, more sustainable levels of investment.
Prices: China’s economy is on the brink of deflation
Exhibit 12
![]() Hover over/tap the chart to see more details.
Hover over/tap the chart to see more details.
Exhibit 13
- The risk of deflation remained over the third quarter as demand was still weak. Uncertainty hanging over the real estate market - the most important asset class - and financial risks linked to it continued to drag down household sentiment. As long as this situation persists, consumption is likely to remain weak and prices are unlikely to recover.
- The number of cities reporting falling property prices remains high; 45 cities reported prices falls out of 70 cities tracked by the National Statistics Bureau. While this was better than January, when it was 55, the situation stayed nearly flat over the quarter (see exhibit 12). Prices falls continue but not in panic mode. On average prices fell by 0.6 percent in September year on year.
- After contracting by 0.3 percent in July, the consumer price index (CPI) stayed flat at the end of the quarter. CPI for the first nine months was 0.4 percent, well below the government’s 3 percent annual target. The risk of slipping in and out of deflation will remain until the economy shows more signs of stabilization.
- Contracting food and energy prices contributed to the low CPI. In September food prices dropped by 3.1 percent compared to the same month last year, while fuel prices fell 1.1 percent. Core inflation excluding food and energy prices, which are more volatile, was just 0.8 percent In September year on year.
Consumers are holding back on consumption, but they are eager to enjoy their freedom after enduring months of strict anti-Covid measures last year. Stronger demand for travel over the summer months pushed up prices for hospitality and tourism services by 12.3 percent in September year on year. - The producer price index (PPI) slightly improved after contracting by 5.6 percent in June year on year, its sharpest fall since 2009. The pace of price falls eased steadily over the quarter, though they still contracted by 2.5 percent in September. The PPI has now been in deflation since October 2022 and improvements are likely to be slow. Purchasing prices for building or industrial materials are only gradually emerging from the steep decline over the past year (see exhibit 13).
What to watch: Real estate price stabilization is vital for better consumer sentiment and demand.
Labor market: Employment woes are still far from over
Exhibit 14
![]() Hover over/tap the chart to see more details.
Hover over/tap the chart to see more details.
Exhibit 15
- Any recovery in China’s labor market remains fragile, despite better economic data over the third quarter, including improved employment figures. Challenges persist, and growth in wages and employment is weak. In response, the government has continued to roll out new support measures, including subsidies for social insurance contributions or training measures.
- In the July and August, a total of 2.46 new urban jobs were created, bringing new jobs this year up to 9.24 (see exhibit 1). This development has helped bring registered unemployment down to 5 percent in September, the lowest rate since December 2021.
- However, youth unemployment remains severe. After it hit an all-time high of 21.3 percent in June, the government stopped publishing data. However, the Ministry of Human Resources and Social Security (MOHRSS) has been busy promoting graduate recruitment fairs, which suggests the situation has not improved substantially.
- Sluggish wage growth reflects the weak labor market and contributes to subdued consumption. Sentiment on future wage growth hardly improved recording 95.4 in August. It remains near record low levels and far below the pre-pandemic three-year average of 122.1.
- Latest survey data from German Chamber of Commerce in China provides further evidence of slower wage growth (see exhibit 2). German companies expect wage growth of 4.9 percent this year and a subsequent drop to 4.5 percent in 2024.
- The pace of minimum wage adjustments has notably slowed down, which has a strong impact on migrant workers. By the end of September, only seven provinces had increased their minimum wage levels. By contrast, 21 provinces made adjustments in 2021 and 10 in 2020.
What to watch: Employment insecurity remains a drag on sentiment, which will only change when the labor market improves.
Retail: Consumption recovery gains pace but is still vulnerable
Exhibit 16
![]() Hover over/tap the chart to see more details.
Hover over/tap the chart to see more details.
Exhibit 17
- More consumption is vital to stabilize the economy, so the government drew up multiple supportive measures to counteract the weakness seen in H1. The State Council issued a 20-point plan in July to sup-port consumer spending that includes a home appliances trade-in program and promoting tourism. It add-ed a new round of tax breaks for families, to mitigate the cost of looking after children and elderly relatives and free up cash for consumption.
- Consumption expanded in Q3 more strongly than expected, giving the economy a much-needed boost. Re-tail spending rose from 3.1 percent at the end of Q2 to 5.5 percent in September year on year. Spending on big ticket items improved. But it is still weak, despite the support measures to encourage people to buy home appliances. (see exhibit 16).
- Services remain the bright spot, outpacing spending on retail. Households continue to flock to restaurants; spending expanded by 13.8 percent by the end of Q3 year on year and outpaced 4.6 percent growth for commodity retail during the same period. A newly introduced data series on retail services with includes culture, sports and health care services rose by 18.9 percent in the first nine months of 2023.
- Nonetheless, consumer sentiment is still stuck at low levels, a sign of persistent insecurity. Consumer’s willingness to spend has barely improved, which helps explain households holding back on spending on big ticket items (see exhibit 17). The slump in the real estate sector continues to be a major drag on sentiment. The uncertainty surrounding the real estate sector will need to stabilize for consumption to get on a stronger footing.
- Retail spending is still around 10 percent below the pre-pandemic trend, providing amble space for im-provement. Normalization of spending patterns continues to be rather slow. This leaves room for more policy support to unleash the potential and to help stabilize the economy over the coming months.
What to watch: The uncertainty around real estate will need to settle to facilitate stronger consumer spending.
Author(s)

Former Chief Economist

Former Senior Economist (Brussels office)

Senior Analyst
Author(s)
Former Chief Economist
Former Senior Economist (Brussels office)
Senior Analyst