picture alliance / CFOTO
Inhalt
Studie
Growing asymmetry: Mapping the import dependencies in EU and US trade with China
Key findings
- The dependence of the EU and the US on goods they mainly source in China has increased significantly over the last 20 years, while China has reduced its reliance on manufactured goods sourced mainly on US and EU suppliers. This is the result of analysis based on our new database providing information about global bilateral import dependencies from 2000 – the MERICS Trade Dependency Database.
- China's import dependency on the rest of the world has risen sharply in value terms because of a surge in imports such as iron ore and soybeans. But excluding such primary products, the country's import dependencies relative to total imports or gross domestic product (GDP) have remained relatively stable. China's diversification away from technology-intensive inputs from advanced economies is the main driver of the asymmetry of dependencies between China and the US and EU.
- The European Union and the United States have become dependent on certain Chinese goods in recent decades. Both regions’ dependencies on imports from China center on machinery and electronic equipment in value but involve a range of sectors overall. For instance, textiles and home furniture have remained product areas of significant reliance on Chinese imports.
- This growing imbalance calls for more European efforts to better monitor and reduce the gap though import diversification and industrial efforts. As doing so will be a costly and complex endeavor, the EU has to carefully target its resources at the most pressing and critical needs.
Introduction: The MERICS Trade Dependency Database pinpoints product areas to "de-risk"
The MERICS Trade Dependency Database shows how heavily the European Union and the United States have become dependent on certain Chinese goods in recent decades, while China has developed domestic alternatives to many traditional imports from advanced economies. Quantifying the shift from what was once roughly a balance to what is now a huge imbalance in dependence on certain goods makes for essential reading – and is just one of the many data-driven analyses our new tool makes possible.
Europe, for example, typically imports more than 90 percent of magnets, a key component of battery production, from China. This creates risks and constraints for the development of production chains. Given China’s strength throughout the battery value chain from rare earth extraction to refining and even battery innovation, any attempt to divert supply from China would be costly and could hamper European competitiveness further down the value-chain as well as the region’s green transition.
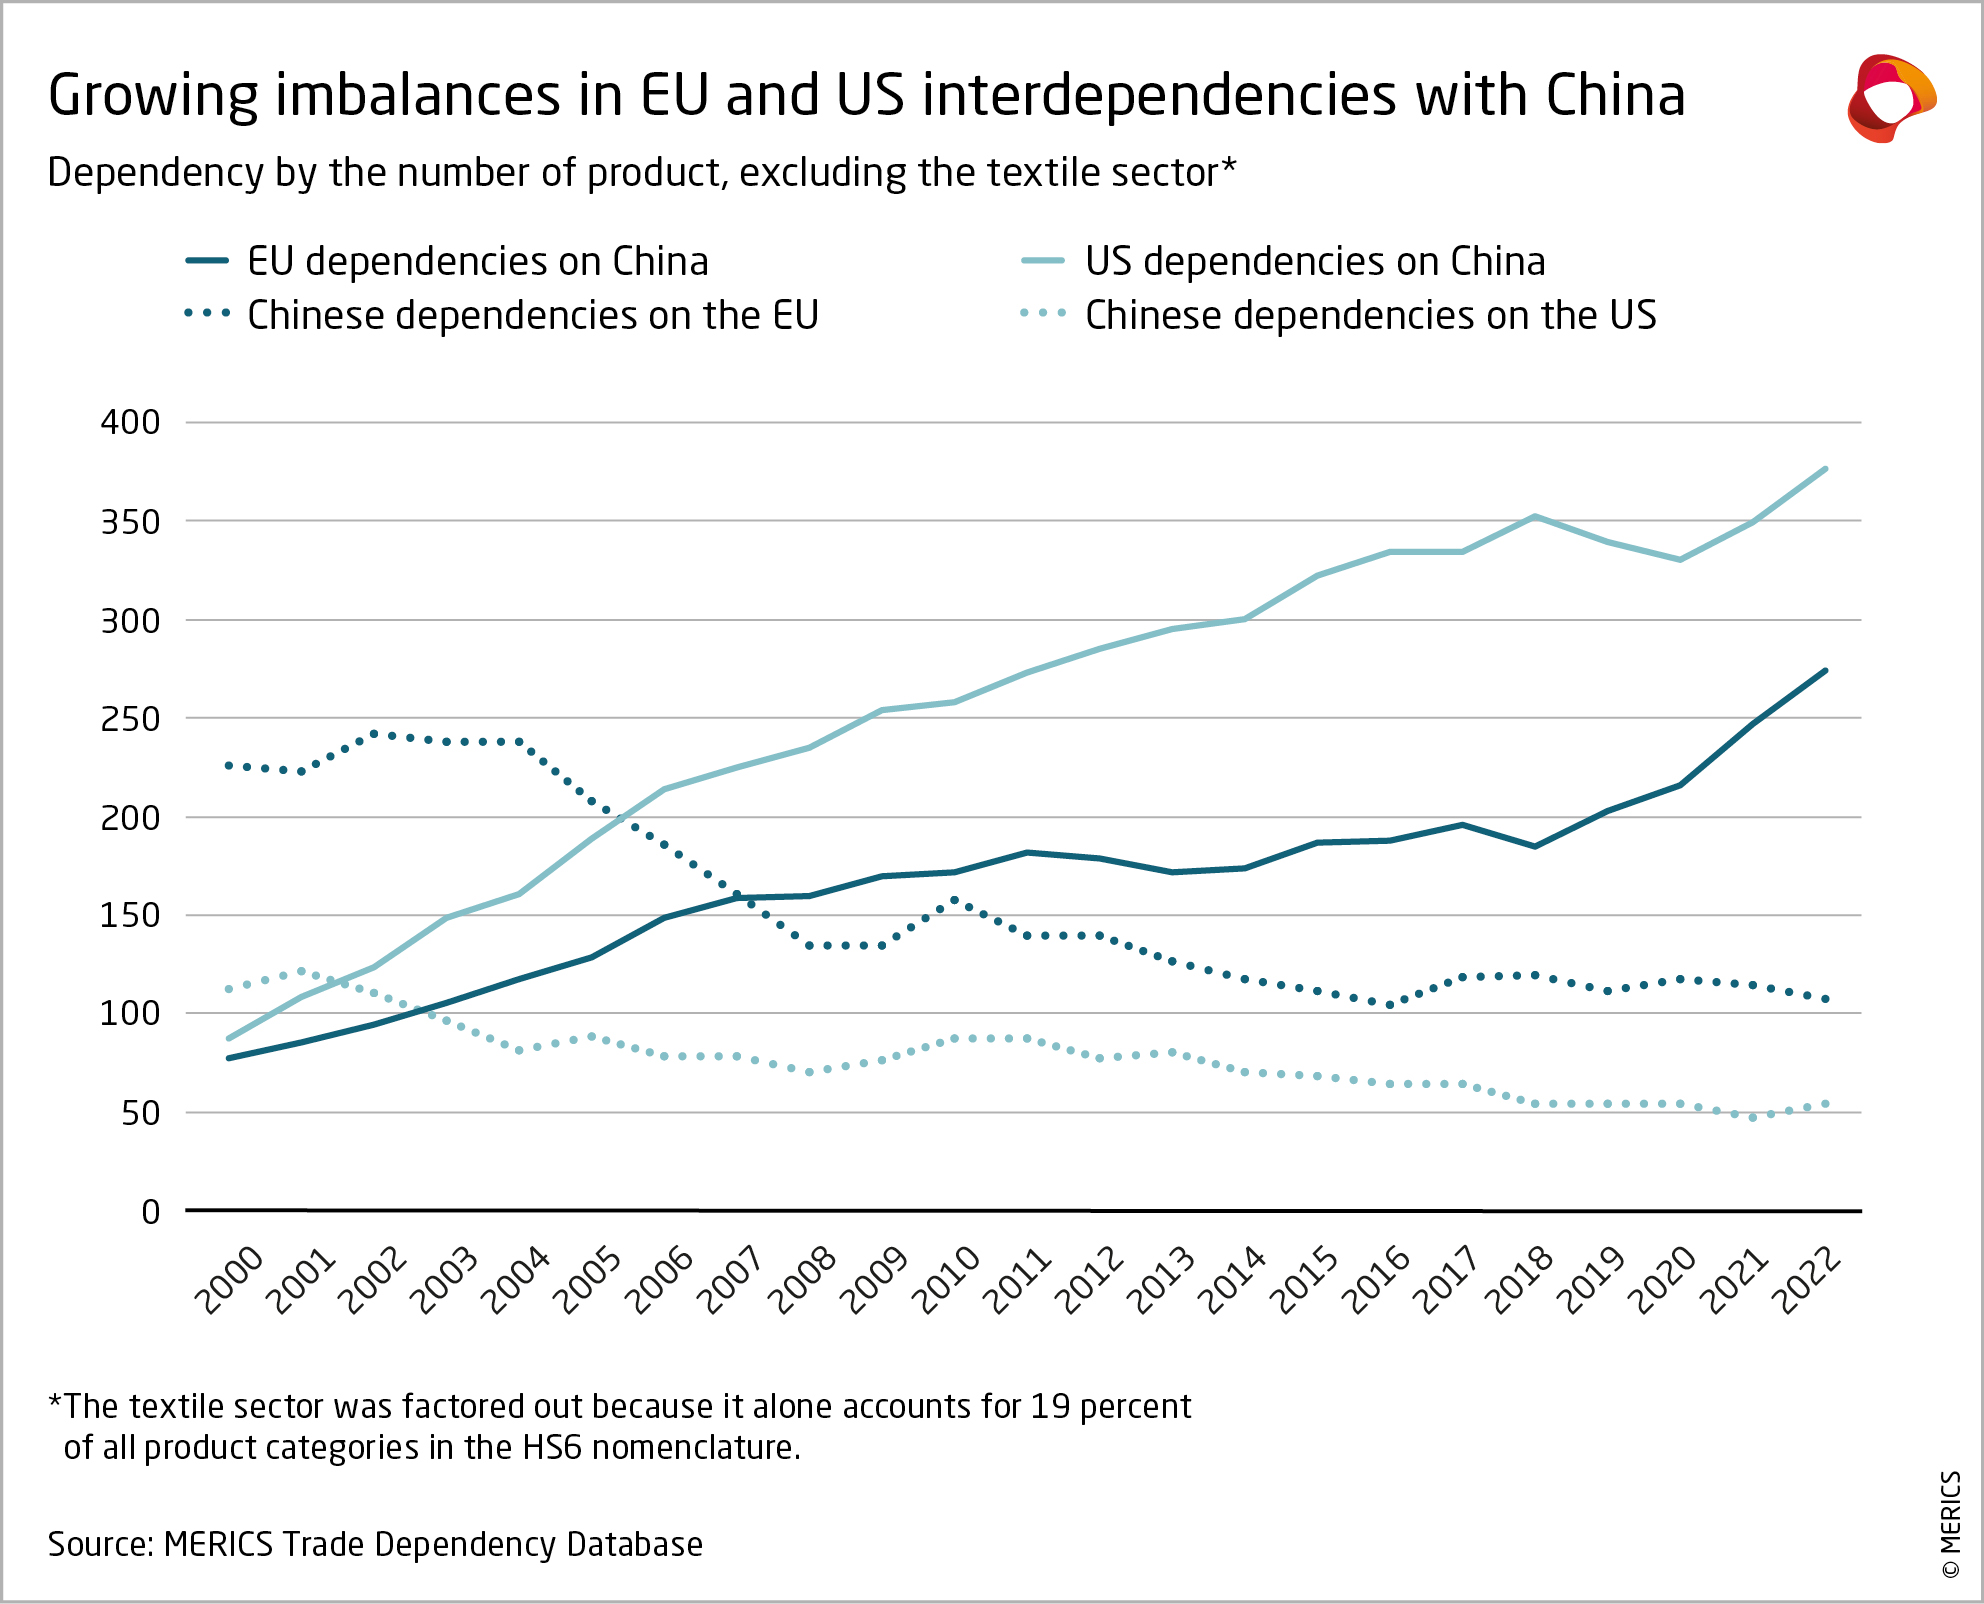
The US in 2022 relied heavily on imports from China in 532 of just over 5,000 product categories, a near-fourfold increase from 2000, while the EU counted 421 similar import dependencies, roughly three times higher than 20 years before. Over the same period, China roughly halved the number of products for which it relies on the US from 116 to 57, as well as the number of goods for which it relies on the EU from 235 to 120. This marked asymmetry in trade dependencies will grow further, especially if the EU fails to act. The US has begun to address the problem – and the database shows the effects this has had.
The risk of relying on imports of goods from only one foreign partner has vaulted onto the political agenda. The Covid-19 pandemic sparked global concerns about the resilience of the global supply of health-care products and other critical goods, the economic recovery that followed saw production bottlenecks lead to a scarcity of products related to communications and information technologies, and Moscow’s war on Ukraine led Europe to rethink its habit of buying vast quantities of oil and gas from Russia.
Growing geopolitical tensions have made issues related to trade dependencies – how to lower one’s own and exploit those of other states – regular features of political debate. More confrontational Sino-US relations have led to a multiplication of import tariffs, export controls and trade sanctions, setting the tone for more localized, though often more heated crises. This new geopolitical reality and potential flashpoints like Taiwan demand a thorough understanding of interdependencies.
No examination can ignore China. It has become the world's factory, accounting for 35 percent of global industrial output and 18 percent of global goods exports. Beijing's ambition to reform the world order has led to confrontations with the Western powers that dominate it. Xi Jinping has not shied away from exploiting other countries' dependence on Chinese goods – sometimes to the point of economic coercion, as in the case of Lithuania after it allowed a “Taiwanese representative office” to open in Vilnius.
The US and the EU have responded by developing policies to "de-risk" their relations with China, starting with reducing trade dependencies. But Beijing has also mapped out its ambitions to contain critical dependencies, formalizing them in 2020 under the concept of "dual circulation," which distinguishes between largely self-sufficient economic activity within China and separate exchanges with the rest of the world. A tradition of managing dependencies has only made Beijing's quest for self-sufficiency more urgent.
Trade dependencies have become an integral part of how the US and the EU, on the one hand, and China, on the other, think about their relationship with each other. But this framing has so far been done without granular historical data – a gap the MERICS Trade Dependency Database hopes to fill. Using the six-digit Harmonized Item Description and Coding System (HS6), the MERICS Trade Dependency Database can identify bilateral trade dependencies for 5,113 products and show how they have evolved since 2000.
The MERICS Trade Dependency Database details all bilateral import dependencies since 20001. The MERICS Trade Dependency Database shows the dependence of each country on specific imported goods and their country of origin since 2000 to the most recent year in the underlying trade database (2022 for now). A country is defined as dependent on an imported product if:
- it has a significant trade deficit in that good, as a result of imports being at least twice as high as exports;
- it has a significant bilateral supplier that accounts for at least 30 percent of imports of that good;
- and if there are relatively few suppliers around the world, with the good’s total exports scoring 0.25 or higher on the Herfindahl-Hirschman Index (HHI) of market concentration.
Using the six-digit Harmonized Item Description and Coding System (HS6) of customs authorities worldwide, the database provides detailed bilateral trade-flow data for dependencies in a total of 5,113 product categories. It shows how each country’s product dependencies developed in terms of size and countries of origin. This allows users to gauge the extent of a country’s exposure to import dependencies, expressed either in terms of the value of imports or the number of affected product categories.
While the database quantifies a country’s import dependency on particular goods, it cannot be used to assess how critical each dependency is for the importing economy, or how wider vulnerabilities would emerge in the event of external shocks disrupting supply chains. Data limitations also mean that neither services nor value-chain effects – dependencies that reach beyond the supplier of the good – can be covered. Finally, the HS6 product aggregates are often too large to track some goods, especially those with a high level of specification, such as active pharmaceutical ingredients or rare earths and minerals.
Nevertheless, trade import dependencies are extremely revealing. Comparing the number of critical products, import values and sourcing enables an assessment of the severity of the dependencies as a first indicator of potential areas of concern. Quantifying trade dependencies can serve as an important guide for navigating the complicated field of economic vulnerability and signal where de-risking is most needed.
China has diversified dependencies and contained those for secondary products - unlike the EU and US
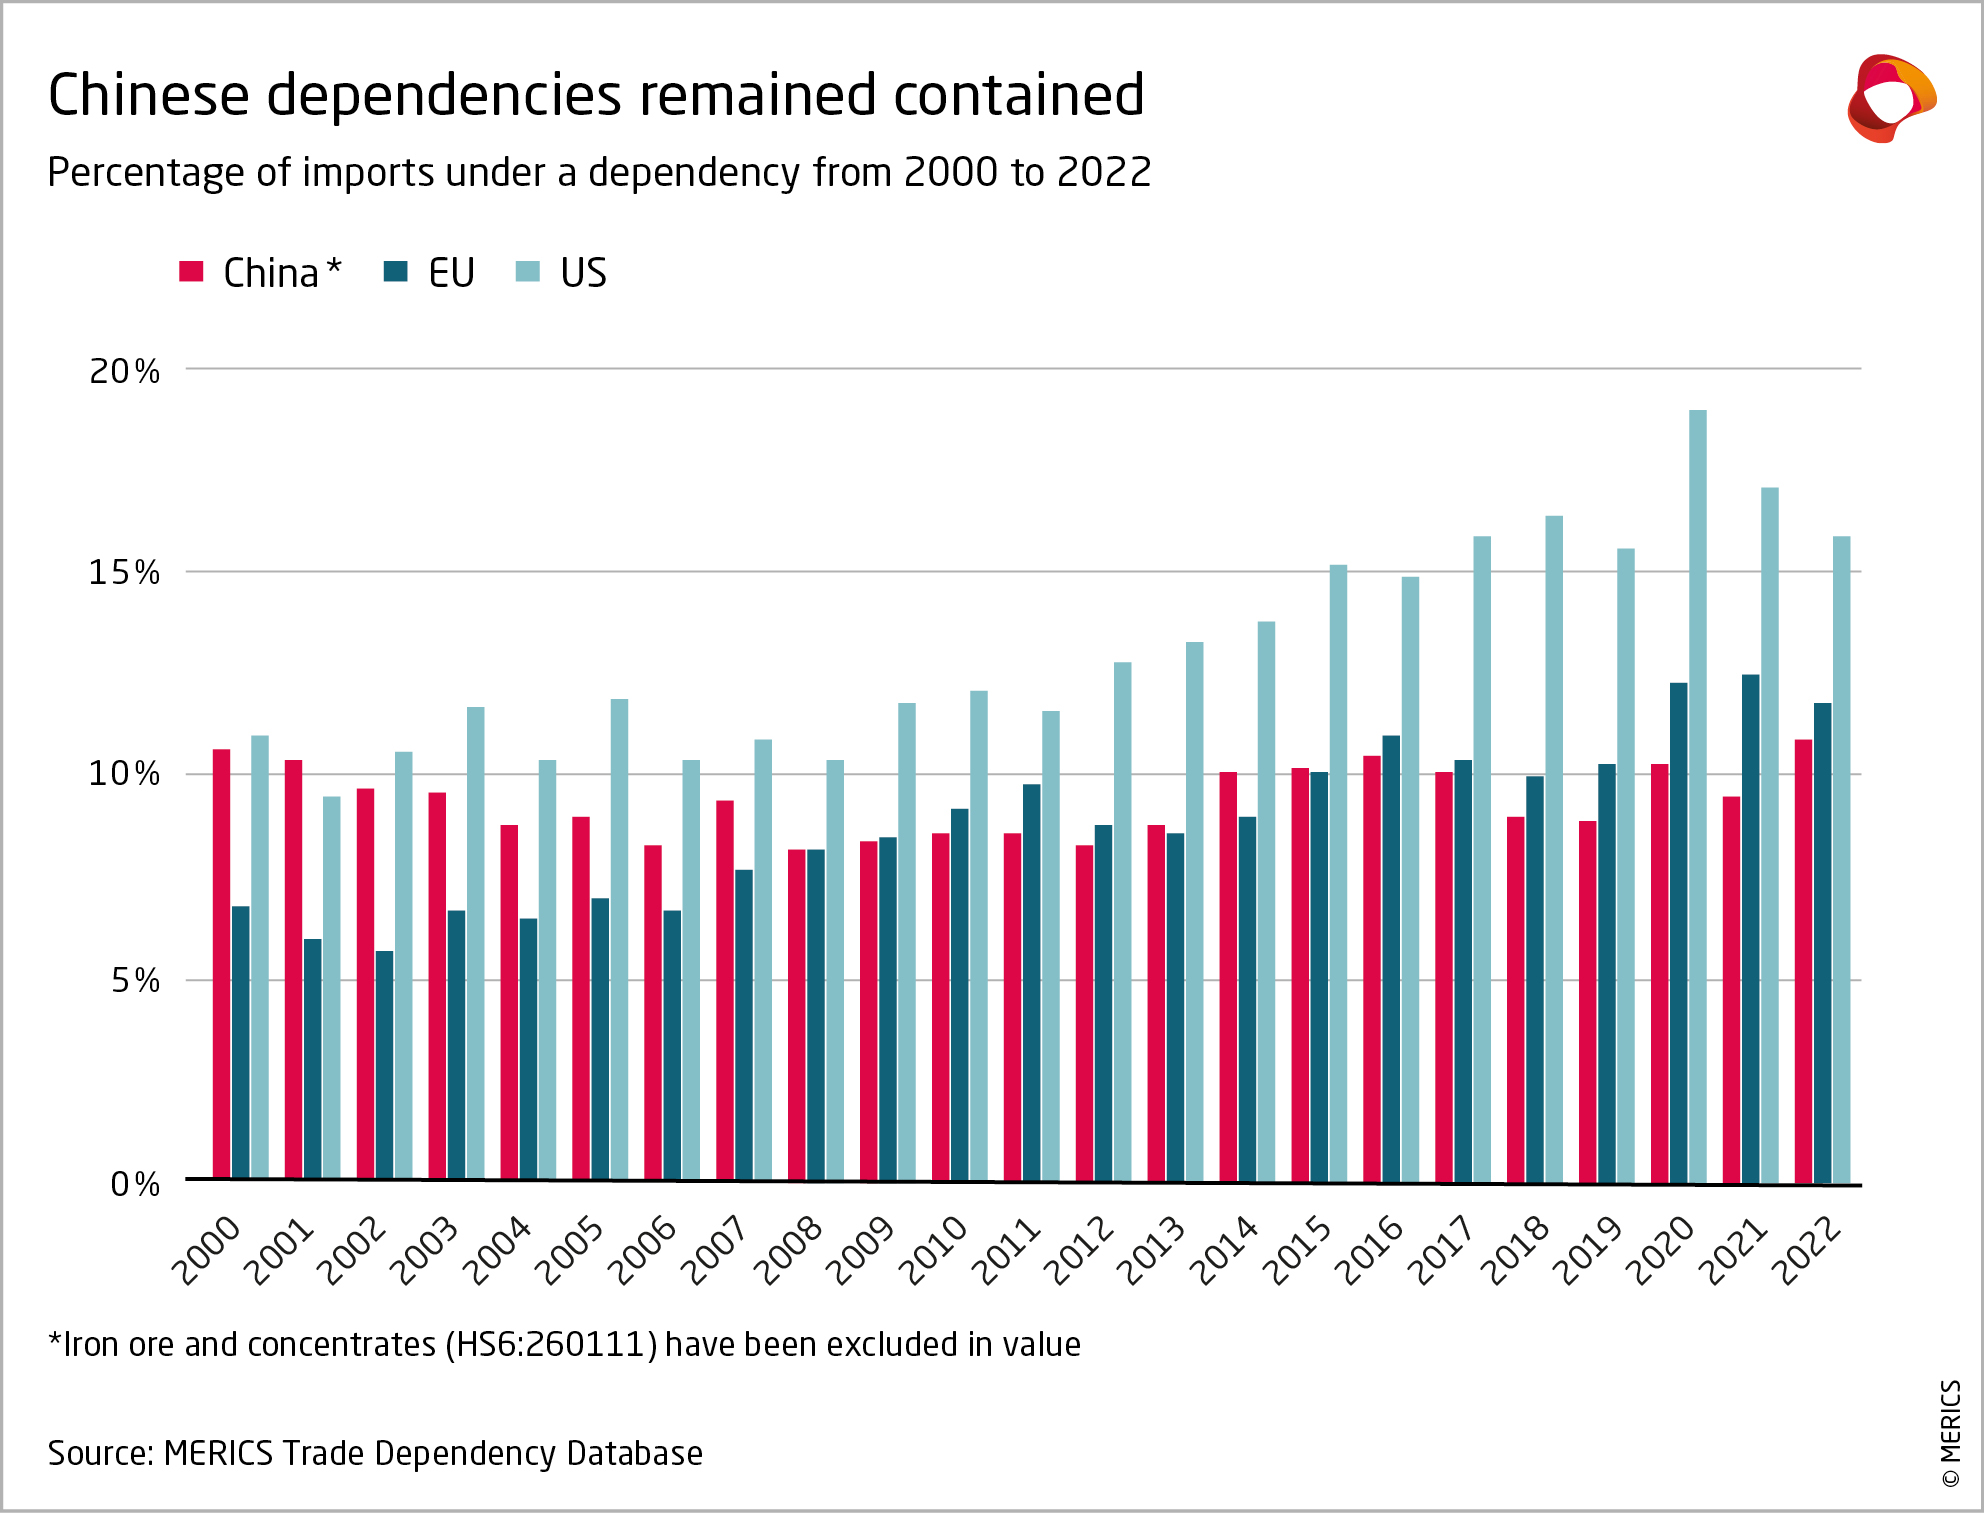
With the exception of selected commodities, China’s trade dependencies have remained relatively stable at around 10 percent of imports for two decades. The total value of imports dependent on suppliers in other countries jumped from USD 18 billion in 2000 to 306 billion in 2022, or 1.7 percent of gross domestic product (GDP). But excluding surges in imports of iron ore, coal (including lignite), and soybeans, China's dependence reached only USD 200 billion in 2022. The share of product categories affected by trade dependence actually falls by about one-third to 7.2 percent from a high of 11.5 percent in 2011 (Exhibit 2).
In contrast, the dependence of the US and the EU on a limited number of suppliers for certain goods has increased significantly since 2000. US trade dependencies as a share of imports rose to 16 percent in 2022 from 11 percent in 2000, while those of the EU hit 12 percent, up from 7 percent. US dependencies as a share of GDP rose to 1.9 percent from 1.2 percent, while those of the EU jumped to 2.1 percent from 0.8 percent. The share of product categories affected by trade dependencies rose almost continuously, to 22 percent from 13 percent in the US and to 14 percent from 9 percent in the EU. Both regions saw dependencies increase most sharply between 2002 and 2011 – after China’s accession to the World Trade Organization (WTO) in late 2001 – and again during the Covid-19 pandemic from 2020 to 2022.
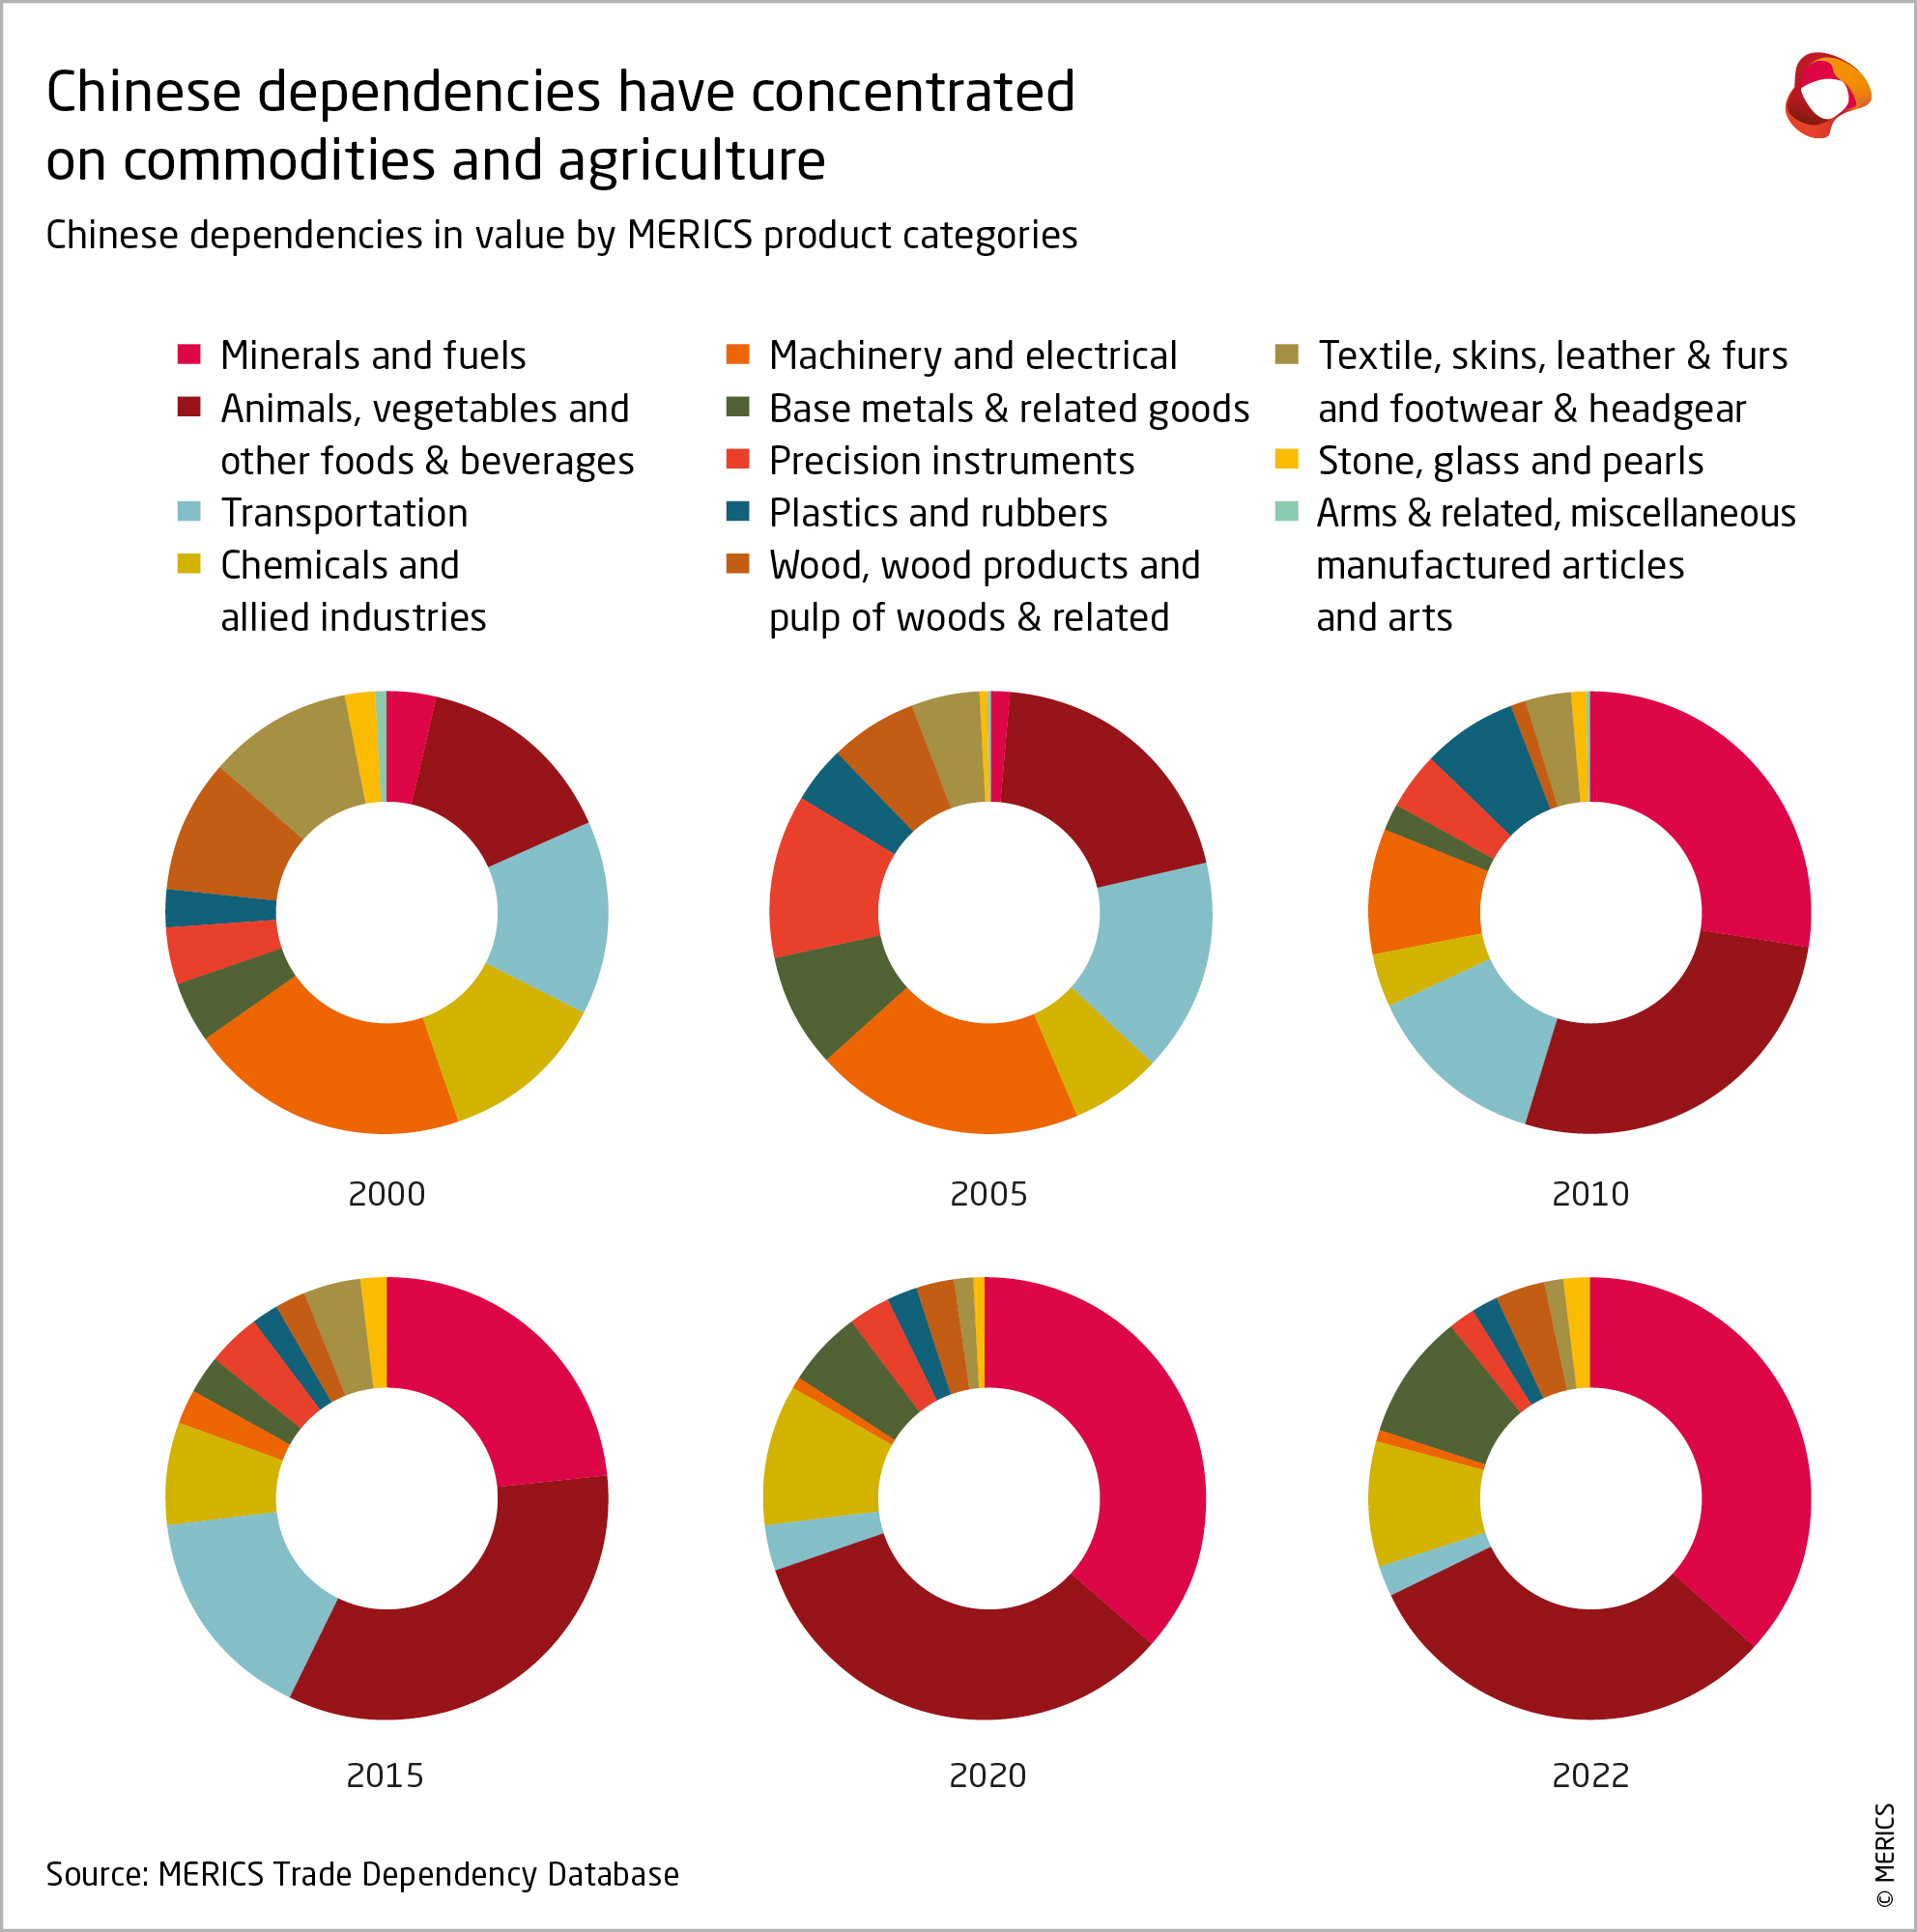
Chinese dependencies have shifted from secondary to primary products. Minerals and fuels, and agricultural products, including food, comprised almost 75 percent of dependencies by value in 2022, up from 22 in 2001 (Exhibit 3). Coal became a significant trade dependency for China after 2010 – unlike oil and natural gas with more diversified supply. But by 2022, iron ore made up a third of all dependencies by value, with soybeans the other main driver of the shift of China’s import reliance towards primary products. Meanwhile, tech-intensive products have become marginal in value, with precision instruments, for example, falling to 2 percent of dependencies by value in 2022 from 11 percent in 2005 (aircraft are a notable exception).
As a result, the number of products for which China is dependent on only a few suppliers has fallen. Dependencies in “Machinery and electronic equipment”, for example, have decreased from 137 in 2001 to 55 in 2011 and 22 in 2022, less than 3 percent of the products in this category. From 2000 to 2010, China reduced trade dependencies on less complex products like weaving, knitting and washing machines as well as extraction and construction equipment. After that, this happened in more advanced goods, such as semiconductors or centrifuges, which slowed the rate of decline. Notable dependencies remain in the areas of advanced metal and glass designing machinery and agricultural machinery.
While dependencies in the Transport category also decreased in number, to 6 from 23 products, chemicals formed the one notable exception to this trend. Although marginal in terms of import value, China was in 2022 still reliant on only a handful of foreign suppliers for 69 products, roughly as many as 2008. These were ether-related substances and other organic chemicals; ammonia, sulfates and other inorganic compounds, and catalyzers; fatty acids and other mixed substances. Nevertheless, the import value of chemical, transport-related and electrical products fell to 12 percent in 2022 from 47 percent two decades earlier.
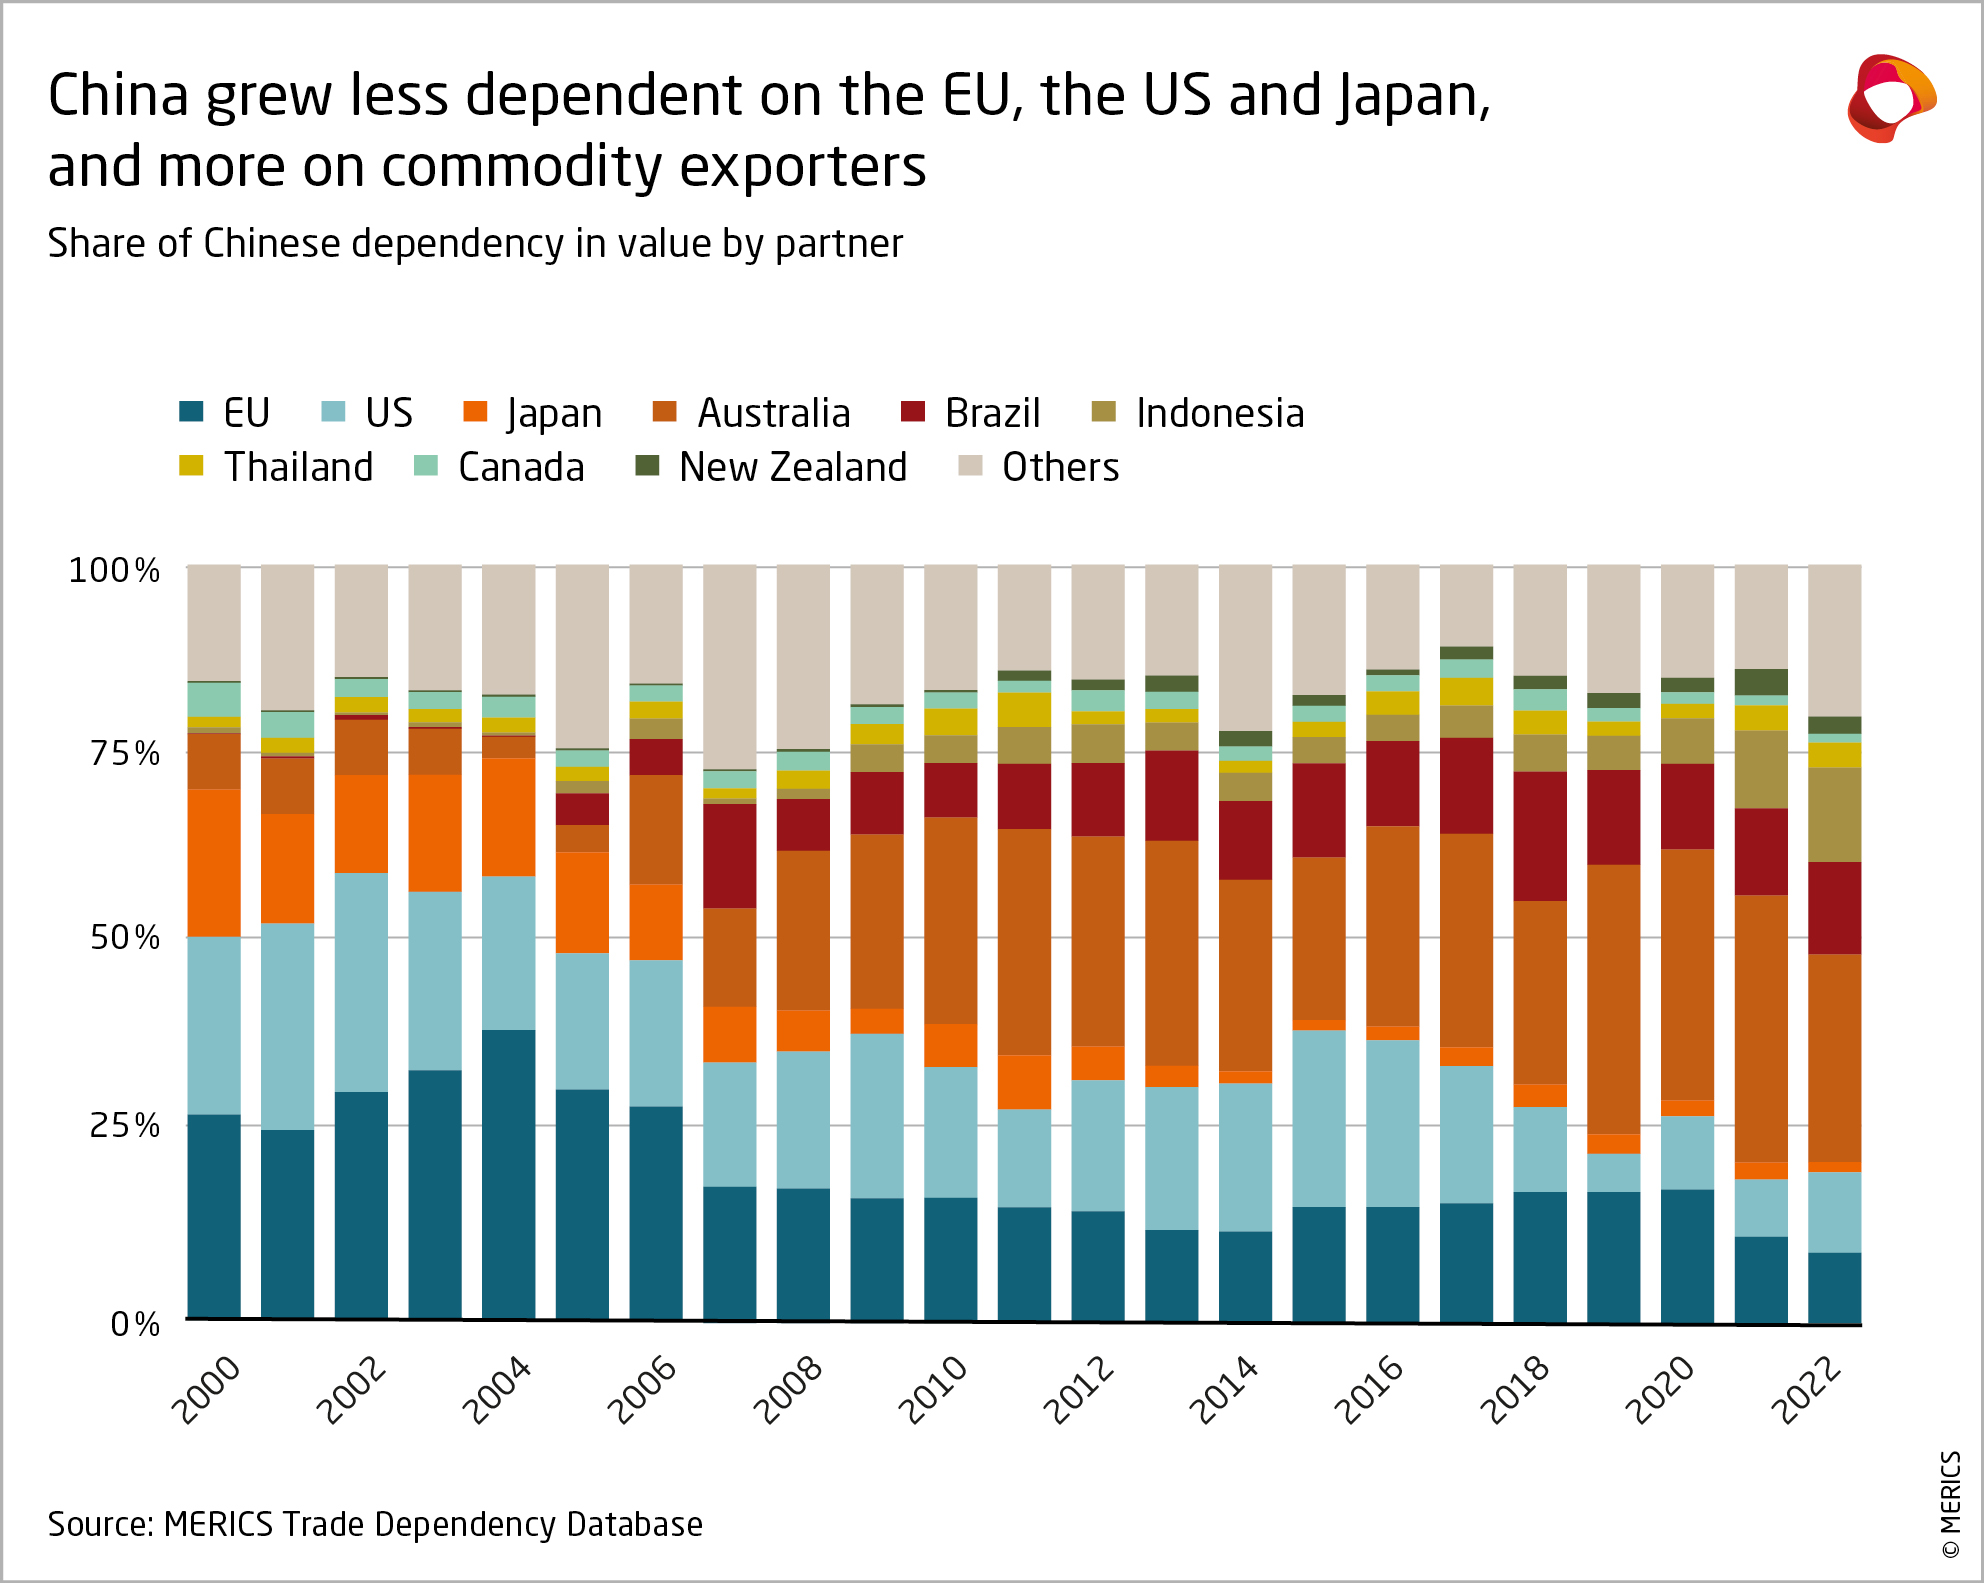
Changes in sectoral distribution have shifted Chinese trade dependencies away from technology-intensive advanced economies and towards commodity-exporting countries, predominantly in the Southern hemisphere. The US, the EU and Japan accounted for only 35 percent of the total value of Chinese trade dependencies in 2022, down from 73 percent in 2001 (see Exhibit 4). This trend has since 2018 mainly been driven by the US raising tariffs and other import restrictions on Chinese goods – and Beijing in response directing the sourcing of critical supplies like soybeans, aircraft and coal away from the US. Meanwhile, China’s EU trade dependencies broadly stabilized in the last decade, both in terms of value of annual imports – around USD 30 billion – and number of products – between 100 and 150 items.
Even advanced, knowledge-based economies are seeing a shift of Chinese dependencies towards primary products. In both value and number, agricultural and food products in 2022 made up more than a third of China’s imports dependent on the EU, twice the rate a decade earlier. Meanwhile, the same category made up 90 percent of the value of China’s imports dependent on the US (and two-fifth of the number of products). At the same time, the country’s reliance on countries like Australia, Brazil and Indonesia went from below 10 percent to close to half of all dependencies by value. This trend was driven by primary products.
China continues to rely on advanced economies for the import of technology-intensive products. Such goods by value and product type still comprise roughly half of Chinese imports dependent on the EU, with pharmaceutical goods, machinery and precision instruments standing out. But complex products tend to get lost in global customs data, as they often fall under broadly defined HS6 product categories and as a result get counted with less advanced products. Depending on their end use, advanced semiconductors, for example, fall into four product lines alongside basic chips, while tech-intensive products tend not to inflate import values as they are often cheap to make – and their more expensive product licenses are not paid at the border.
The EU and the US have become more dependent on imports from China - especially electronics
The rise in EU and US trade dependencies over the last 20 years has been driven mainly by imports from China. Products sourced from only a few Chinese suppliers made up roughly 70 percent of both US and EU trade dependencies by value in 2022, up from 20 percent in 2000. Meanwhile, EU and US dependencies on China as a share of product categories hit a more moderate 8 and 10 percent respectively in 2022 – and factoring out the category-heavy textile sector further reduced these dependencies by a third. Nonetheless, Europeans and Americans still rely on China more than all other countries put together.
EU and the US dependencies on imports from China center on machinery and electronic equipment in value but involve a range of sectors overall. Both regions on either side of the Atlantic have seen the value of trade dependencies concentrate on electronics – they made up 41 percent of EU trade dependencies by value in 2022, up from 27 percent in 2011, and 36 percent of US trade dependencies, up from 27. Nonetheless, textiles and home furniture have remained product areas of significant reliance on Chinese imports, contributing 24 percent of total dependencies by value in both the EU and the US in 2022.
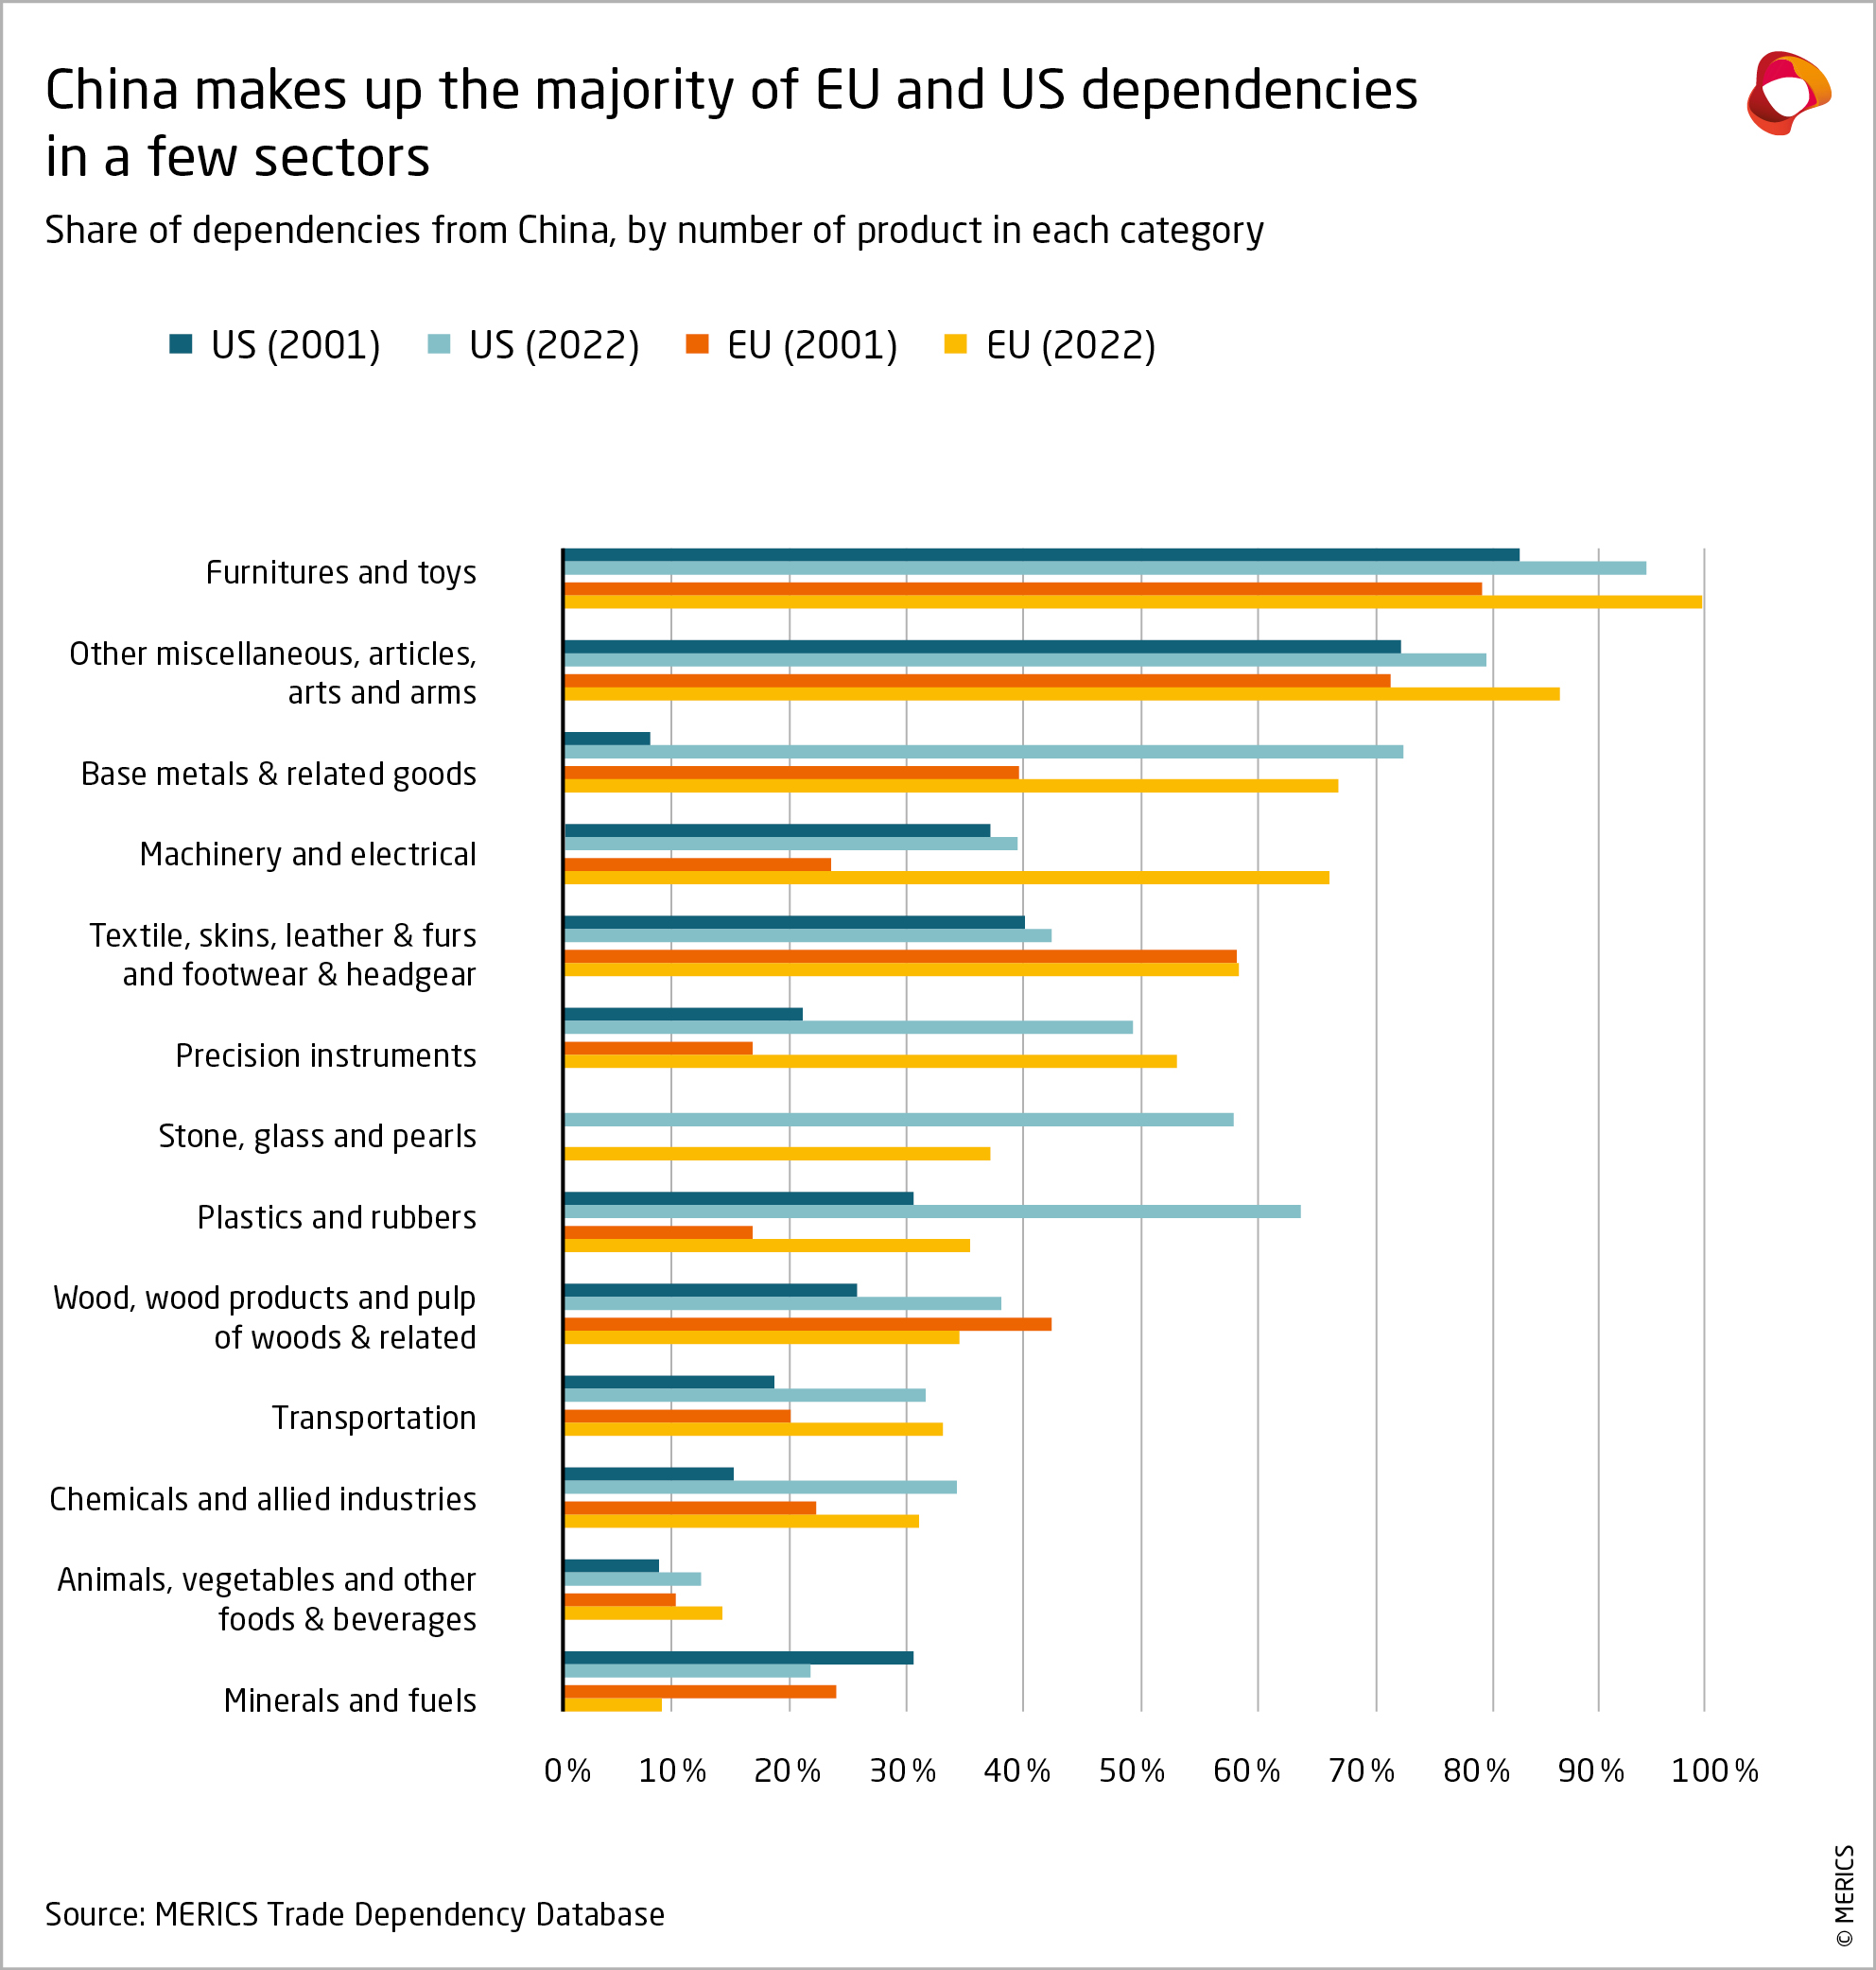
Their dependencies span a broad range of categories, with an increase in the share of products sourced from only a few suppliers in most of them. The EU’s trade dependency on Chinese furniture and toys hit 92 percent of all dependencies in this category in 2022, in the US “only” 81 percent, both up from two-thirds in 2000. Starting from lower levels, tech-intensive sectors have witnessed faster growth in the number of products on which the EU and US are dependent. Both regions were reliant on China for more than 50 percent of all precision-instrument products imported in 2022, up from 20 percent or less in 2000.
But one notable transatlantic divergence does emerge. EU dependencies have since 2016 further concentrated on China, while US have diversified away – likely in part a consequence of the Trump Administration’s hawkish approach to China after entering office in 2016 and the start of trade measures in 2018. The US has seen its trade dependencies on Vietnam and Mexico increase, but they, in turn, have become more dependent on imports from China. This raises the question in how an increase in indirect dependencies could undercut the benefits of any decrease in direct dependencies.
Conclusion: The EU needs to focus on specific product areas to keep de-risking affordable
The MERICS Trade Dependency Database shows in great detail how US and EU trade dependencies on China are increasing, while China’s reliance on the US and EU is decreasing. The widening gap between these dependencies is a call to action. Europe, for one, would be foolhardy to allow this asymmetry to continue to get bigger – no less a figure than Xi Jinping has openly spoken of Beijing’s goal to “tighten international production chains' dependence on China” and leverage them for geopolitical ends.5
As mentioned at the beginning, Europe typically imports more than 90 percent of magnets, a key component of battery production, from China. This creates risks and constraints for the development of production chains in Europe. China unofficially denied the supply of graphite – a critical mineral for battery production – to Sweden from 2020 to 2024 in the midst of diplomatic tensions and commercial competition from Swedish battery maker Northvolt. Given China’s strength throughout the battery value chain from rare earth extraction to refining and even battery innovation, any attempt to divert supply from China will be costly.6 Higher costs would hamper European competitiveness further down the value-chain as well as the region’s green transition. The complexity of the problem illustrates the need for a long-term, step-by-step multidimensional EU approach.
Firstly, the EU should further investigate what risks these asymmetric dependencies pose. Europe’s vulnerability to a particular product no longer being available for import is a factor of how critical that product is and the likelihood of an interruption to supply. Aside from this metric, the positioning of the product in the production process can also be used as a measure of indispensability – the higher up the value chain, the harder it will be to replace. Also, the political alignment of the importing and the exporting states – for example, as per United Nations voting habits – can flag potential geopolitical problems early.
Secondly, Europeans will have to take targeted action to better monitor and manage critical dependencies to ensure they do not become vulnerabilities in times of crisis. The EU should regularly publish dependency and vulnerability assessments to feed into exchanges with member states, industry and other stakeholders. Ways to reduce the dependencies include:
- diversifying suppliers, as Europe intends to practice for critical minerals (including for magnets and batteries, as mentioned above),
- bolstering domestic production, as Europe has done for magnets, batteries and semiconductors,
- building strategic stocks, as most European countries have done for pharmaceuticals,
- and bolstering deterrence, for example, with the EU’s “anti-coercion instrument” to investigate and counter undue economic pressure.
The US, with a bigger domestic market and less financial constraints, have chosen a forceful albeit most likely sub-efficient approach to reducing their dependencies on Chinese imports through broad tariffs and massive subsidies to domestic production in critical products. Europeans would be poorly advised and most likely incapable of such an approach, for multiple political and economic reasons. Efforts have been initiated as mentioned above to establish a more subtle approach. Those now need to be sustained, structured and extended, while remaining somehow targeted to assure efficiency and credibility.
- Endnotes
1 | For a more detailed explanation of the MERICS Trade dependency database, see Annex.
2 | Mejean I. and P. Rousseaux (2024). “Identifying European Trade Dependencies”. In: Europe’s Economic Security Edited by Jean Pisani-Ferry, Beatrice Weder di Mauro and Jeromin Zettelmeyer. CEPR; Vicard V. and Wibaud P. (2023). « EU Strategic Dependencies: A Long View ». CEPII Policy Brief. CEPII; Arriola, C., et al. (2024). “Towards demystifying trade dependencies: At what point do trade linkages become a concern?" OECD Trade Policy Papers. OECD Publishing; Baur A. and L. Flach (2022). “German-Chinese Trade Relations: How Dependent is the German Economy on China?”. EconPol Policy Report 6. CESifo.
3 | Mejean (2024) assessing EU dependency filter out non-critical goods as well as the one from allied partners.
4 | Carrara S., Bobba S., Blagoeva D., Alves Dias P., Cavalli, A. Georgitzikis, K. Grohol, M. Itul, A. Kuzov, T. Latunussa, C. Lyons, L. Malano, G. Maury, T., Prior Arce A., Somers J., Telsnig T., Veeh C., Wittmer D., Black C., Pennington D. and Christou M. (2023). “Supply chain analysis and material demand forecast in strategic technologies and sectors in the EU – A foresight study”. Joint Research Centre (JRC). Publications Office of the European Union, Luxembourg.
5 | Xi Jinping. Certain Major Issues for Our National Medium- to Long-Term Economic and Social Development Strategy (国家中长期经济社会发展战略若干重大问题). Qiushi. November 2020.
6 | Clean energy supply chains vulnerabilities – Energy Technology Perspectives 2023 – Analysis - IEA
Annex I: The MERICS Trade Dependency Database – Scope and methodology
How does MERICS define and quantify import dependencies?
The MERICS Trade Dependency Database contains data about the import dependencies of every country since 2000. Based on 5,113 different product categories, it quantifies the import value of each product on which the country is dependent, as well as the total value of all such critical goods. On top of the direct value of trade under dependencies, the database also flags the number of products that share the three characteristics that makes a country dependent on the import of a particular good.
MERICS uses a three-pronged set of conditions to define import dependency. By doing so it follows well-established practice. Most analyses, including of MERICS (2020), Tresor (2020), CAE (2021), the European Commission (2021), Baur and Flach (2022), the European Commission (2023), Vicard et Wibaud (2023), Mejean et Rousseau (2024), and OECD (2024), draw on an approach first used in a 2017 study by the International Monetary Fund (Dew and al.). However, the definitions differ in detail:
- Condition 1 – MERICS flags a significant trade deficit when a country’s imports of a good are twice as high as its exports. This is different in degree to the approach of the European Commission, whose 2021 study sees even the smallest trade deficit as a qualifying condition, and of the French Treasury (2021), which focuses on cases in which imports of the good from outside the EU are higher than imports of the good from other EU countries. MERICS, on the other hand, does not regard a slight trade deficit in a good as posing a sufficient risk of developing into a dependency.
- Condition 2 – MERICS defines a significant bilateral supplier as being a country that accounts for more than 30 percent of all the imports of a particular good. By contrast, both the European Commission and the French Treasury use the Herfindahl-Hirschman Index (HHI) for market concentration, albeit with different thresholds. MERICS has taken the view that the HHI is a more important measure of concentration of suppliers (see below) and considers the one-third import-threshold as a more tangible measure of a supplier’s potential effect on a market.
- Condition 3 – MERICS considers a concentration of suppliers a potential driver of dependency if world exports of the product reach 0.25 or higher on the HHI. This threshold is the reference used in EU and US competition investigations into excessive market concentration. It can indicate, for example, that one supplier has 40 percent market share and four other suppliers 15 percent each. This approach is not so different to that of the OECD (2024), which uses an HHI of 0.2. By contrast, the Commission (2021) deems a concentration of suppliers if imports from outside the EU are higher than imports from within the EU. MERICS (2021) sets a threshold of more than 30 percent of world exports, and the French Treasury (2021) uses the centrality index computed by IMF (2017).
These conditions are applied to all imports of each country to determine dependencies. Imports are classified into a maximum of 5,113 categories, in line with the 1996 version of the official Harmonized System nomenclature, HS6, of six-digit customs codes under the World Customs Organization. As almost every country in the world uses HS6 categorizations to track trade flows, this is the most granular trade dataset available that offers international comparability. To offer consistent data reaching back to 2000, MERICS uses the HS categorization from 1996.
Dependencies are identified over two years of trade, as annual trade flows can be volatile and face temporary disruptions – and so mislead in identifying actual dependencies. For instance, the 2021 dependencies are determined based on an aggregate of 2020 and 2022 data. This smoothens the effects of potential year-specific events that might have only temporarily altered trade flows.
What countries or regions does MERICS consider?
The MERICS Trade Dependency Database treats the EU as a consolidated entity, member states are – as of now – not covered individually. The database does not include statistics for imports and exports within the EU.
A second dataset will soon be added to consider member states as separate entities. Beyond the EU, other groupings of countries will be added later, namely, continental aggregates, major trade agreements, trade zones or fora like G7 or G20. Each of those groupings will belong to specific sub-datasets within the database.
What is the focus of the MERICS Trade Dependency Database?
Our database analyzes dependencies by looking at statistics of directly imported goods. It is based on trade data, goods are being assigned to a country by origin of import, irrespective of the nationality of the producing entity. It is important to stress that the strategic nature of dependencies is taken into consideration in the analysis. Dependencies are assessed solely on the basis of the trade data – with, for instance, T-Shirts given the same weight as advanced chips.
Services and patent data are not part of our dataset. Dependencies on exports (i.e., a concentration of demand) are not covered either. Our analysis of the data focuses on assessing dependencies and does not veer into discussions of vulnerabilities.
Annex II: Product categories in the merics trade dependency database
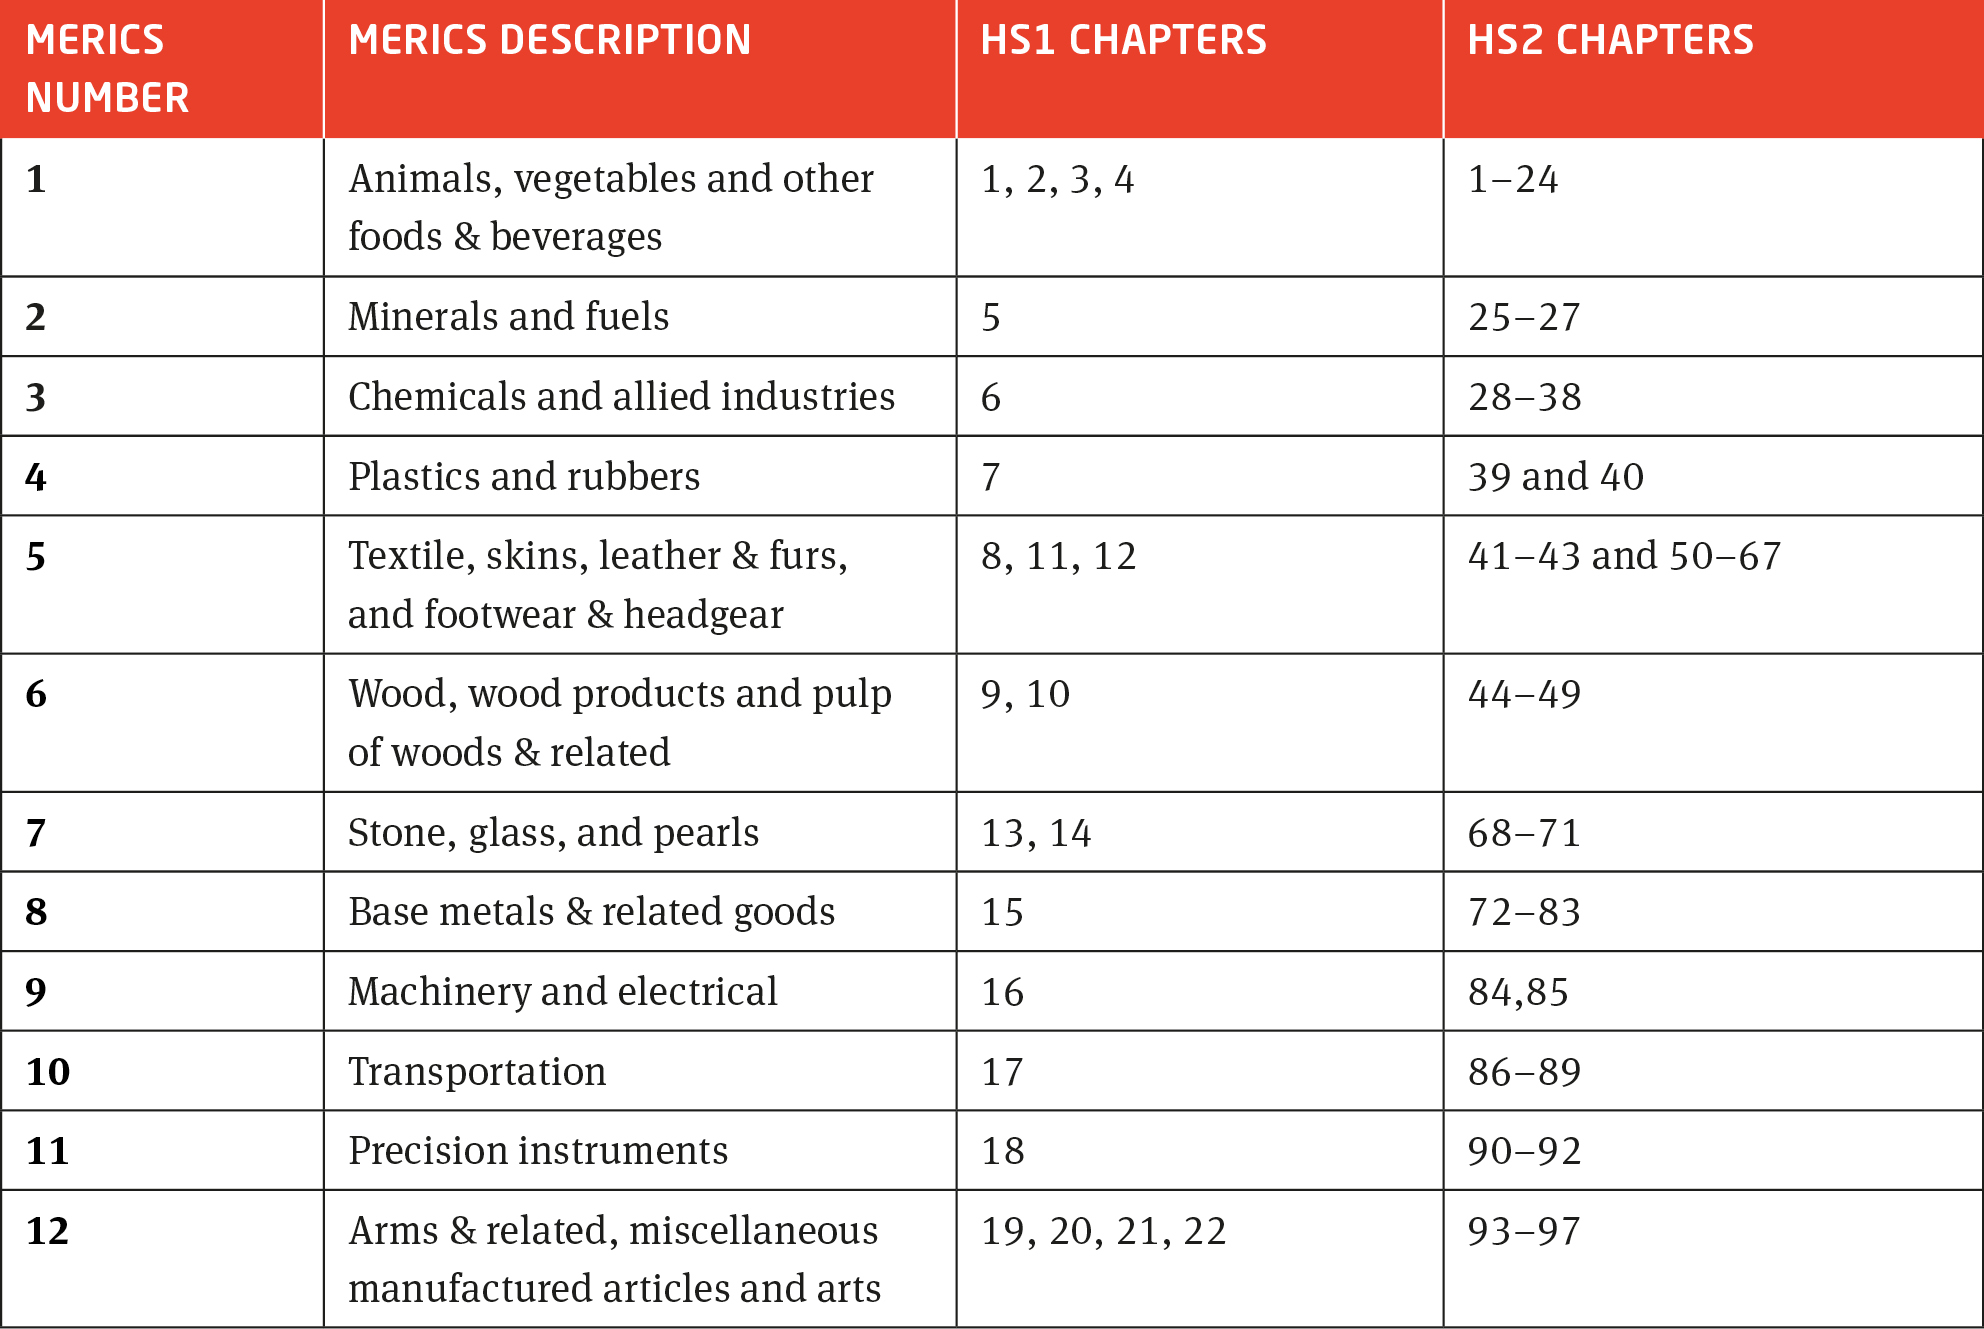
The basic nomenclature for goods used in the database is the traditional Harmonized System, for which detailed categories can be found here. The dataset also used a common aggregate categorization called HS sections. Finally, for readability, we have developed our own categorization very similar to HS sections. For the exact details, see the table below for the construction of that MERICS categorization.
Bibliography
Arriola C., et al. (2024). “Towards demystifying trade dependencies: At what point do trade linkages become a concern?". OECD Trade Policy Papers No. 280. OECD Publishing
Baur A. and L. Flach (2022). “German-Chinese Trade Relations: How Dependent is the German Economy on China?”. EconPol Policy Report 6. CESifo
Bonneau C., Nakaa M. (2021), „Vulnérabilité des approvisionnements français et européens“. French Ministry of the Economy and Finance, DG Tresor, 2021
European Commission (2021), “Strategic dependencies and capacities". Brussels, Staff Working Document SWD (2021) 352 final
European Commission (2022), “EU strategic dependencies and capacities: second stage of in-depth reviews", Brussels, Staff Working Document, SWD (2022) 41 final
European Commission, Arjona R., Connell García W., Herghelegiu C., (2023), “An enhanced methodology to monitor the EU’s strategic dependencies and vulnerabilities", Single Market Economics Papers WP2023/14, European Commission
Dew B., Y. Korniyeko, M.Pinat (2017). “Assessing the fragility of global trade: the impact of localized supply shocks using network analysis”. IMF Working paper 17/30.
Jaravel X., I. Méjean (2021). “Quels intrants vulnérables doit-on cibler?”. Focus du CAE, Conseil d’Analyse Economique. Paris
Mejean I. and P. Rousseaux (2024). “Identifying European Trade Dependencies”. In: Europe’s Economic Security Edited by Jean Pisani-Ferry, Beatrice Weder di Mauro and Jeromin Zettelmeyer. CEPR
Vicard V. and Wibaud P. (2023). “EU Strategic Dependencies: A Long View“. CEPII Policy Brief. CEPII
Zenglein M. (2020). “Mapping and recalibrating Europe’s economic interdependence with China”. MERICS China Monitor.

This "MERICS Report" was made possible with support from the “Dealing with a Resurgent China” (DWARC) project, which has received funding from the European Union’s Horizon Europe research and innovation programme under grant agreement number 101061700.
Views and opinions expressed are however those of the author(s) only and do not necessarily reflect those of the European Union. Neither the European Union nor the granting authority can be held responsible for them.
Autor(en)

Ehemaliger Senior Economist (Büro Brüssel)
Autor(en)
Ehemaliger Senior Economist (Büro Brüssel)
Inhalt