MERICS China Economic Indicators

MERICS China Economic Indicators

MERICS China Economic Indicators is our quarterly analysis of China’s economic data. The MERICS Economy and Industry team provides updates on the latest macroeconomic trends and their impact on Europe. The findings are presented on a dashboard in interactive charts and explained in concise texts. In-depth analyses put a spotlight on the most important developments. 

MERICS Members have privileged access to this publication. Learn more about the Membership program here.

merics-economic-indicators-visual

Graphs

MCCI registers first decline in two years

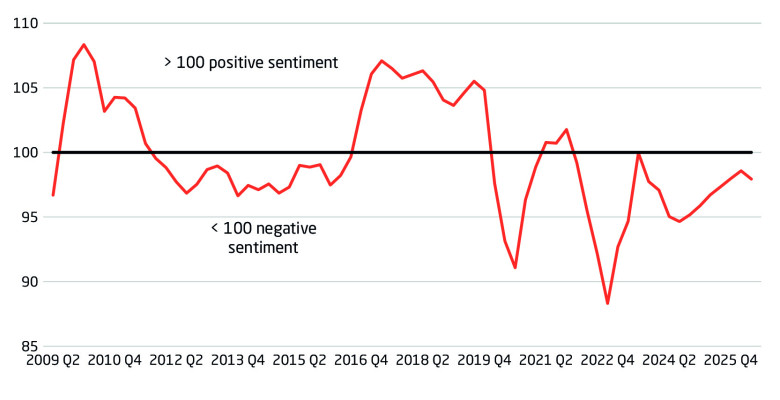
  • First decline in two years: The MERICS China Confidence Index (MCCI) fell from 98.4 to 97.9 in Q2, its first fall since Q3/2024.
  • Broad-based slowdown: The MCCI’s decline reflected deterioration in other indices, such as new orders in manufacturing, new business in the services sector and consumption expenditure as a share of income.

The MERICS China Confidence Index (MCCI) – first developed in 2017 – includes the following indicators: stock market turnover, future income confidence, international air travel, new manufacturing orders, new business in the service sector, urban households’ house purchase plans, venture capital investments, private fixed asset investments and disposable income as a share of household consumption. All components have been tested for trends and seasonality. The index is weighted between household and business indicators.

Last updated: July 22, 2026

Q2 GDP growth dips as construction activity falters

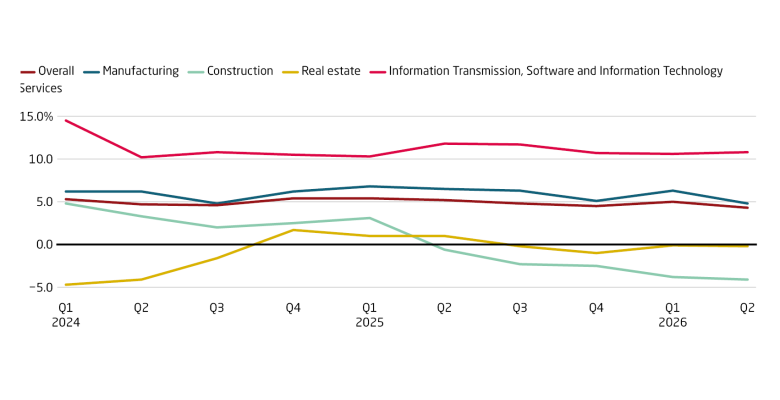
  • Growth weakens: GDP growth was 4.3 percent in Q2, down from 5.0 percent in Q1 and the lowest value since Q4 2022. The fall was mostly due to a steep drop in activity in the secondary sector, where Q2 growth was just 3.0 percent compared to 4.9 percent in the preceding quarter.
  • Building paused: Growth in manufacturing fell by 1.5 percentage points down to 4.8 percent in Q2, while construction activity contracted by 4.1 percent. The shrinking construction and stagnant real estate sectors have been important factors in the decline in investment levels over the last 12 months.
  • Patchy progress: However, growth in the tertiary sector remained robust, up 5.1 percent in Q2. Software and IT services stood out as a major source of economic dynamism. This shows China’s focus on high-tech sectors is delivering results, while leaving broad sections of the economy out in the cold.

Last updated: July 22, 2026

Surge in ICT equipment income lifts overall manufacturing profits

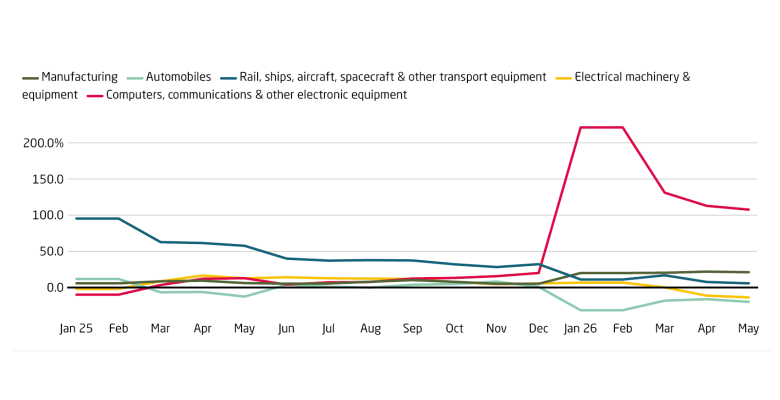
  • Bottom line: Overall operating profits for industrial enterprises continued to rise in Q2, reaching 19.9 percent for the January-May period. But business conditions varied substantially by industry. Among the 41 sectors covered in the National Bureau of Statistics update, 22 recorded shrinking profits during the period January to May.
  • Irresistible chips: Profits in the ICT sector rose by 108 percent.  This huge growth is linked to the global AI boom, which has spurred demand for related technologies at home and abroad. China’s value-added output of integrated circuits climbed by 23.1 percent and exports in USD terms rose 96.1 percent in the first half of the year.
  • Fierce foes: Companies in the automotive sector have seen profits contracting by 19.8 percent. Ruthless competitive behavior among Chinese firms, referred to as “involution”, has put downward pressure on profits in many sectors, including autos. More than ever before, European firms are likely to be confronted with Chinese firms willing to sell products below cost to gain market share.

Last updated: July 22, 2026
 

Elevated prices for high-tech products and commodities boost imports

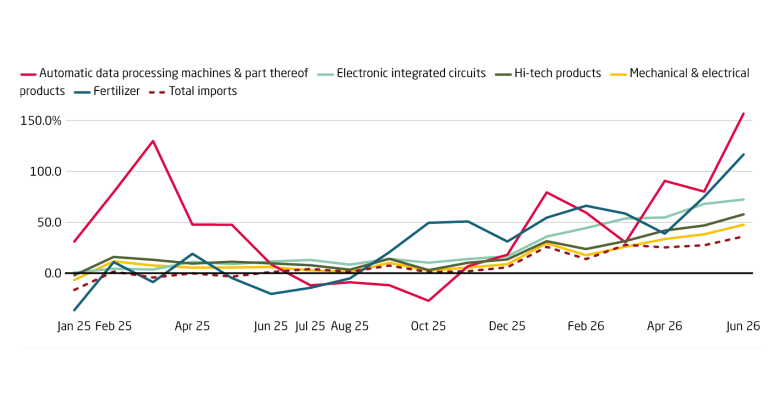
  • Value not volume: China’s surprise import surge did not reflect stronger domestic demand, being mostly driven by price effects. For example, in H1 the year-on-year increase in the import values of diode and similar semiconductors surged 12.4 percent, while electronic integrated circuits soared 55.8 percent. Volume growth rose only 1.8 percent and 8.1 percent respectively. 
  • AI boom: Rising prices for AI-related tech are driving China’s rising import data. Semiconductor-related goods were the largest import category, as June imports from major chip manufacturers in South Korea and Taiwan soared 85 percent and 41.1 percent respectively.
  • High-tech exports high: The export value of China’s high-tech products jumped 52.3 percent year-on-year in June, with particularly strong growth in electronics and integrated circuits. Electric vehicle exports also surged, up by over 100 percent by volume and value in June.

Last updated: July 22, 2026

China’s exports to developing countries surge

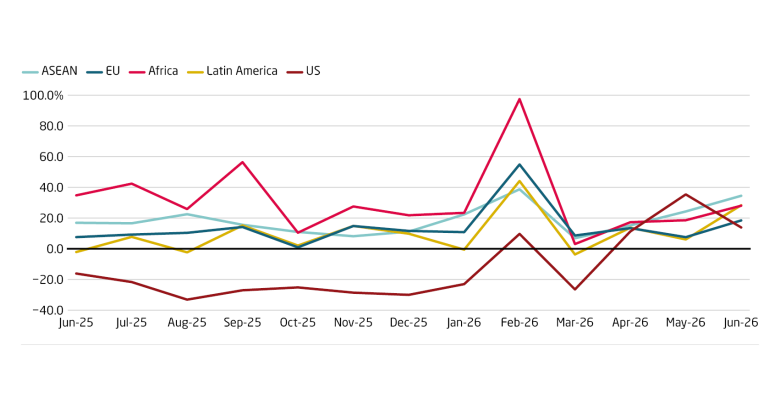
  • Fast growth from a low base: Exports to Latin America and Africa both grew by more than 28 percent in June, though from a low base, while exports to the EU grew by 18 percent. In absolute terms, exports to Europe and Asia were far more valuable; H1 exports to ASEAN totaled 396.23 billion USD and those to the EU 312.26 billion USD, whereas Latin America totaled 159.43 billion USD and Africa 130.01 billion USD. 
  • Mixed bag: Exports to Africa, Latin America, and ASEAN in Q2 grew 21.4 percent, 15.9 percent and 24.6 percent respectively, on sales of intermediate and capital goods, such as machinery, manufactured goods, electronics and vehicles and, increasingly, cleantech. This trend is widening China’s trade surplus with Vietnam, which grew by 12.8 percent in H1.
  • EVs surge: EVs are powering China’s exports to ASEAN, hitting a record 1.2 billion USD in May, prompted by sharp fuel price increases caused by the war in Iran. Chinese OEMs are rapidly expanding their footprint, squeezing out European suppliers.

Last updated: July 22, 2026

The value of new housing has fallen by 60 percent since 2021

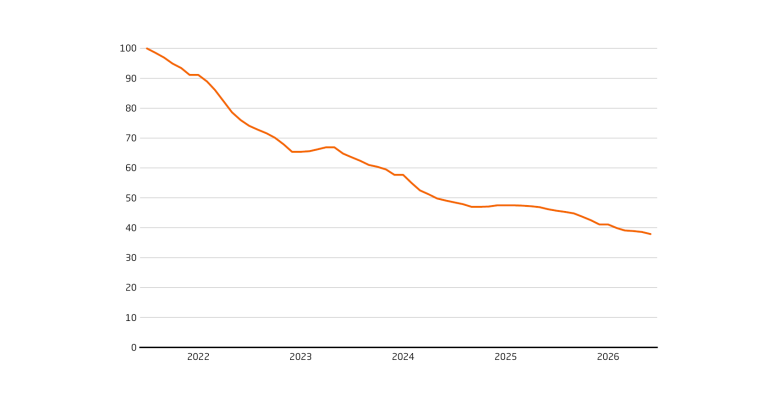
  • The real estate crisis deepens: New-home prices fell 3.3 percent year on year in June, marking the fifth year of falls in the market. New-home sales value has fallen by around 60 percent since July 2021. Prospects remain weak, with real-estate development investment down by 18.0 percent year on year in H1 2026. Many households are still repaying mortgages agreed when property valuations were higher, so their financial burden restricts fresh spending. Falling land-sales and tax revenues are tightening local governments’ already constrained budgets.
  • Squeeze on middle-class tightens: The ongoing decline in residential sales value is painful for China’s middle class, as investment gains melt away at a time when their working age children are struggling to find jobs and aging parents need support. The bleak mood encourages precautionary saving and dampens consumption.

Last updated: July 22, 2026

Manufacturing FAI turns negative, but investments stay high in key subsectors

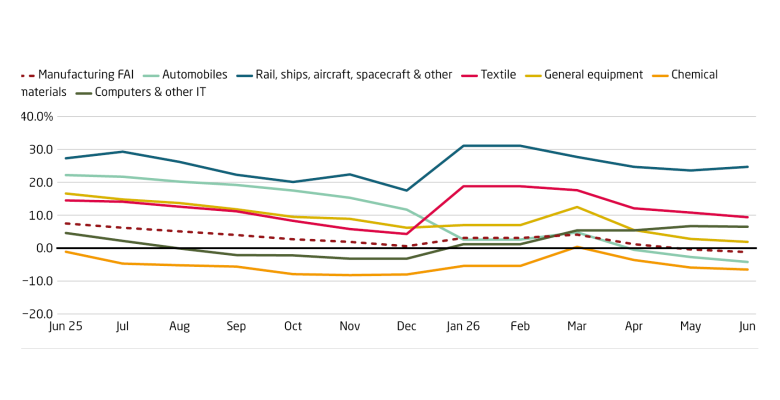
  • FAI decreases again: Overall fixed asset investment (FAI) fell by 5.7 percent in H1 compared to a year earlier, returning to the pattern of decline seen since last September, after a brief increase in Q1.
  • Manufacturing investment loses momentum: Alongside a 8.4 percent drop in services, manufacturing FAI dropped for the first time since the start of the COVID pandemic in 2020. Manufacturing investment (usually a strong contributor to overall FAI) fell 1.2 percent year on year in H1, a bad sign for economic growth.
  • Industrial modernization continues: Manufacturing sectors deemed strategic by Beijing, such as IT manufacturing, rail, aerospace and aircraft manufacturing, continued to benefit from investment. Rising investment in equipment and textiles suggests China’s industrial upgrading efforts have not waned and are reaching into traditional industries too. 

Last updated: July 22, 2026

Rising producer prices reflect hikes in energy and commodity prices

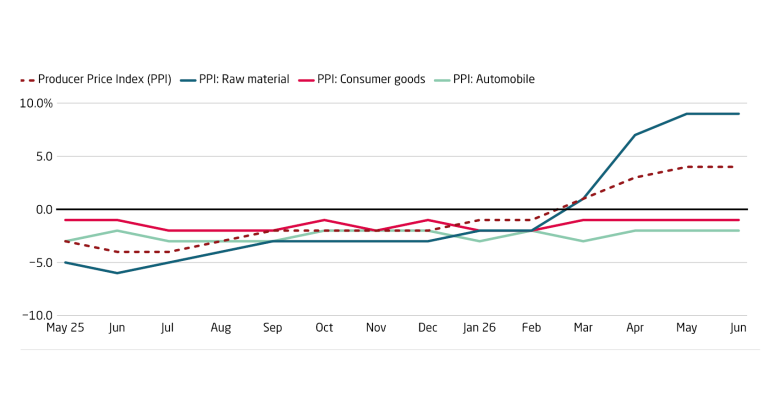
  • Overall PPI and CPI rises driven by higher input prices. Producer prices (PPI) showed a 4.1 percent increase in June after nearly three and a half years of declines. Likewise, consumer prices (CPI) also showed a modest rise, with a 1.0 percent increase year-on-year in June. However, these gains do not point to recovery in domestic demand; they reflect higher energy and commodity prices caused by the conflict in the Middle East
  • Prices in consumer-oriented sectors keep dropping. Prices continued falling in most consumer-oriented sectors, such as automobiles, consumer goods or pharmaceuticals, suggesting Beijing’s measures to fight overcapacities have not shown results. Electronic equipment was the only major sector with a meaningful price rise (3.3 percent yoy in June) due to demand from the AI boom.

Last updated: July 22, 2026

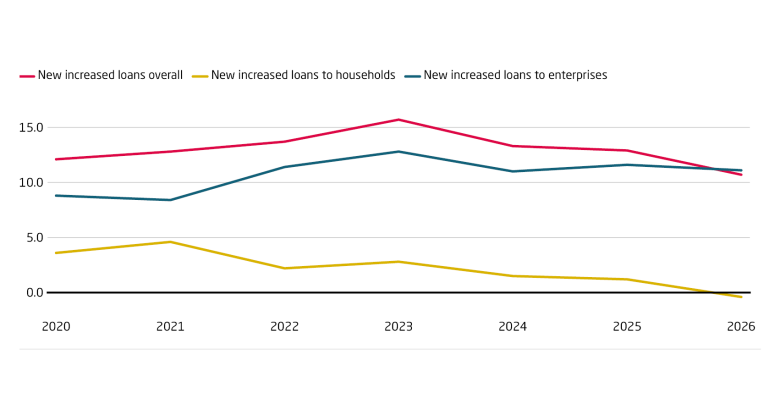
Households are repaying more old loans than taking out new ones

  • Households reluctant to borrow: For the first time on record, in 2026 Chinese households have repaid more old loans than taken out new ones on a year-to-date basis for the January to June period. New increased loans to households amounted to minus 367 billion CNY at the end of June. The discrepancy was even larger for household loans used for consumption, which stood at minus 1.12 trillion CNY. 
  • Weak consumption: Households remain reluctant to consume. The NBS consumer confidence index is lingering at historically low levels. It stood at 89.9 in May 2026, unlike the entire period on record before 2022, when it was always above 100. The unresolved real estate crisis, weak wage growth, and high youth unemployment are all weighing down consumer confidence.
  • Strong enterprise lending: New increased loans to enterprises remained steadfastly in positive territory, with new loans surpassing repayments by 11.1 trillion CNY.

Last updated: July 22, 2026

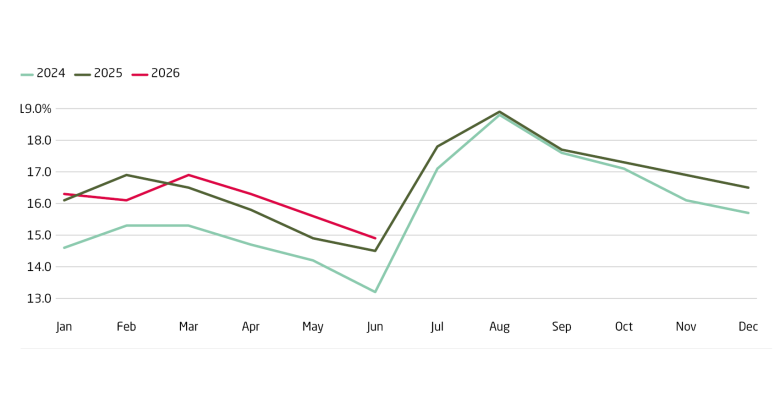
Youth unemployment higher in 2026 than in previous years

  • Youth unemployment is rising: It stood at 14.9 percent in June 2026. Although this was less than in previous months, it was higher than at the same time of year in 2025 (14.5 percent) and 2024 (13.2 percent), suggesting that from year to year, youth unemployment is increasing.
  • Hiring is slowing: This matches developments in hiring, where the number of newly added jobs between January and May has been steadily decreasing for nearly two years, from 5.65 million in 2024 to 5.58 million in 2025 and down further to 5.56 million in 2026.
  • Pressure will increase further: Ominously, youth unemployment is set to rise again, as 12.7 million new university graduates enter the labor market this summer, roughly four percent higher than last year. Youth unemployment traditionally peaks in August, so the question is how high this year’s peak will be and how much pressure will be put on the labor market as a result.

Last updated: July 22, 2026

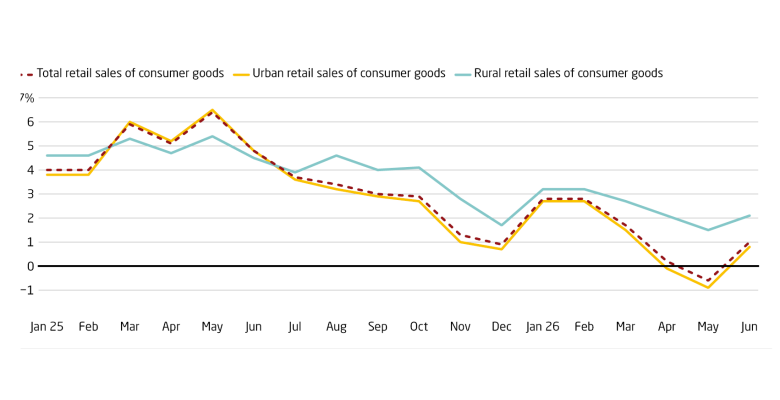
Rural retail sales outperform national sales

  • Weak demand: Retail sales only grew 1.3 percent in H1, with particularly weak growth in Q2.  Retail sales are likely to continue losing steam throughout the year, dragging down overall growth and exacerbating China’s reliance on exports.
  • No splurging: Automobile and furniture sales continued their decline in June, with autos down 16.1 percent and furniture sales dropping 6.6 percent. Declining demand across these categories shows household’s weak appetite for big ticket items.
  • Connecting the rural areas: Rural consumption is proving more resilient than in urban areas and outpaced urban consumption by 1.3 percentage points in H1. Rural consumption is likely buoyed by lower living costs and the development of rural e-commerce, thanks to improved Internet access and logistics infrastructure. 

Last updated: July 22, 2026

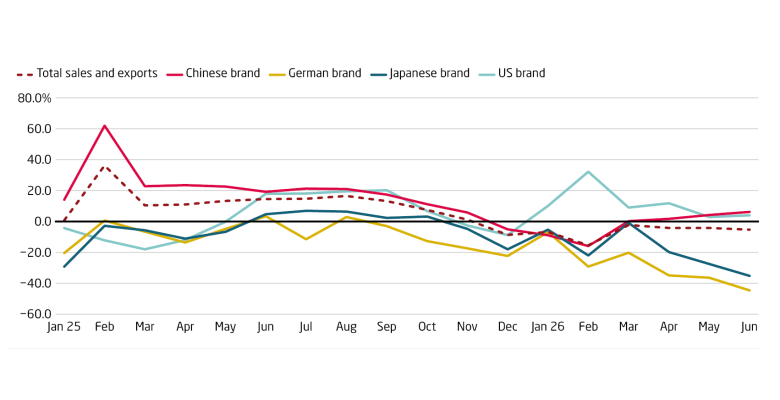
German automakers see largest setbacks as China's auto market shrinks

  • Weak demand: The number passenger cars sold and exported by manufacturers located in China fell by 5.3 percent in June and by 6.0 percent in H1 overall. In the first half of the year, domestic sales of passenger cars were down by 20.4 percent due to reduced subsidies and weak consumer sentiment. Surging passenger car exports, up 70.6 percent in H1, were not enough to make up for the loss of sales in China.
  • German automakers hit hardest: Chinese brands weathered the storm, registering a 6.2 percent increase in the number of cars sold or exported in June. German brands have fared most poorly, with sales and exports from their China operations down 44.6 percent in June and trending downwards. The disappointing performance comes despite huge investments made in production and development by German automakers in China in recent years.  

Last updated: July 22, 2026

Download as PDF

Analyses
Previous editions

Authors