
picture alliance / Kyodo
Tracker
China Economic Indicators
China's economy improves as it braces for external shock
MERICS Economic Indicators Q1/2025
MERICS Q1 analysis: China’s economy lays down a solid foundation in Q1, gearing up for trade war with the US
China’s economy got off to a strong start in the first three months of 2025, even as the world grappled with the turmoil caused by the Trump administration’s attempts to recalibrate global trade. GDP growth was up 5.4 percent in Q1, setting a good opening pace to achieve the annual growth target of around 5 percent. However, tensions with the United States are likely to leave more visible marks on the economy before long.
Strong GDP growth at the start of this year was partly due to Beijing’s stimulus measures in the final quarter of 2024, introduced to counter the double weaknesses of the real estate sector and still-sluggish consumption. The Q1 data also benefited from front loading of orders as buyers scrambled to avoid the impact of the threatened trade war, a trend visible in strong industrial production and exports.
But relatively strong GDP growth cannot overshadow the persistent challenges facing China’s economy. The real estate sector has yet to stabilize and continues to weigh down growth and sentiment. High youth unemployment, deflation, and plummeting private sector profits are reminders that not all is well. Even without the trade war bringing external disruptions, China’s leadership would already be facing significant hurdles to ensure stable economic development.
Another key challenge is weak consumption. Additional support to stimulate consumption was announced at the National People's Congress in March, to avoid further problems in a worsening external environment. The leadership is taking a noticeably more serious approach to boosting consumption, introducing measures such as childcare subsidies, expanded trade-in programs, and limits on excessive overtime. Restoring household confidence and encouraging spending on goods and services will be key to offset any weakening of external demand.
Despite heated rhetoric between Washington and Beijing in recent weeks, any concrete actions and their economic impact have so far been limited. Beijing is holding back from premature large-scale stimulus, waiting for measurable signs of economic fallout. The leadership remains far from panic mode, instead signaling its readiness to ramp up support if needed.
China has used the past five years to prepare for worst case scenarios in its relationship with the United States. Better economic security and greater resilience were high on the policy agenda. While the leadership certainly did not wish for such a scenario, China is ready to take up the fight and unlikely to back down. More economic headwinds are likely in the coming months, but China’s leadership seems prepared to weather a storm.
The MERICS China Confidence Index (MCCI)
The MERICS China Confidence Index measures household and business confidence in future income and revenues. The index is weighted between household and business indicators. It includes the following indicators: stock market turnover, future income confidence, international air travel, new manufacturing orders, new business in the service sector, urban households’ house purchase plans, venture capital investments, private fixed asset investments and disposable income as a share of household consumption. All components have been tested for trends and seasonality.
The MCCI was first developed in Q1 2017.
![]() Hover over/tap the charts to see more details.
Hover over/tap the charts to see more details.
Exhibit 1
Macroeconomics: GDP growth shows strength as the trade war escalates
Exhibit 2
![]() Hover over/tap the charts to see more details.
Hover over/tap the charts to see more details.
Exhibit 3
- Amid growing trade war tensions and ever greater uncertainty about prospects for the global economy, China’s GDP grew by 5.4 percent in Q1, matching the previous quarter but beating market expectations of 5.1 percent. Growth is expected to slow in the coming quarters due to fallout from the trade war with the United States, but China’s strong performance in Q1 provides a solid foundation.
- Strong industrial activity continues to be a major factor driving GDP growth. The manufacturing share of GDP increased by 6.8 percent, the highest pace since Q2 2021. This contrasted with a slowdown to 5.3 percent in the services sector, down from 5.8 percent in the previous quarter. A key reason for the slowdown in services was a sharp downturn in financial services, which slowed from 6.5 percent in Q4 2024 just 3.8 percent.
- Despite strong Q1 growth, some signs of weakness persist. Quarter-on-quarter growth slowed to 1.2 percent (see Exhibit 2). The discrepancy with year on year growth suggests that underlying growth momentum may be easing.
- Major international financial institutions revised their growth forecasts downward following the National Bureau of Statistics’ data release on April 16 (see Exhibit 3), citing the impacts of the trade war with the United States as the key reason.
- The relatively strong performance in Q1 cannot overshadow the growing uncertainty facing China’s economy. Additional government support is likely as China braces for a prolonged confrontation with the United States.
What to watch: The severity of the trade war’s impact will only start to unfold in the coming quarters, triggering more policy support in response.
Business: Industrial sector off to a strong start as it braces for external shock
Exhibit 4
![]() Hover over/tap the charts to see more details.
Hover over/tap the charts to see more details.
Exhibit 5
- Industrial output expanded at its fastest pace since June 2021. Industrial value-added output rose by 7.7 percent year on year in March, up from 6.2 percent at the end of Q4 2024. China’s industrial sector may be bracing for the impact of possible tariff shocks, but it displayed strength in Q1.
- Industrial production was boosted by stronger high-tech manufacturing. High-tech value-added output rose by 10.7 percent in March year on year, up from 7.9 percent in December. A sharp rebound in mining activity also contributed to the improvement in Q1 (see Exhibit 4).
- Automobile production growth slowed to just 8.4 percent in March year on year, down sharply from 15.2 percent growth at the end of the previous quarter. One contributing factor was a slight slowdown of the very high growth in output of electric vehicles (EVs), which still rose by 40.6 percent in March.
- Profitability continued to decline in 2025, slipping by 0.3 percent in the first two months (latest available data). However, this was an improvement on a 3.3 percent contraction last year. The figure for 2025 so far was lifted by a 2.1 percent increase in profits at state-owned enterprises. The situation at private companies worsened - from 0.5 percent growth at the end of 2024 to a 9 percent contraction.
- In March, business sentiment remained positive despite the threat of a trade war on the horizon. After fall-ing below 50 (implying a contraction) in January, the Purchasing Managers’ Index rebounded to 50.5 in March. Strong new orders helped lift the mood (see Exhibit 5).
- The construction sector continues to suffer from the weak real estate market but showed some life in Q1. Cement production expanded for the first time since November 2023, up by 2.5 percent in March year on year. Stronger infrastructure activity may also boost output in the coming months.
What to watch: Companies operating with thin margins, especially export-oriented small and medium sized companies, may be vulnerable to tariff-induced external shocks.
International trade and investment: China’s Q1 trade surplus hits another record high as trade war gets underway
Exhibit 6
![]() Hover over/tap the charts to see more details.
Hover over/tap the charts to see more details.
Exhibit 7
- The chaotically unfolding trade war between the United States and China is fueling uncertainty, already visible in Q1 trade flows. Beijing is bracing for a potential downturn in China’s exports while the leadership pushes back against US pressure and seeks closer ties with other trading partners.
- Frontloading of orders to avoid anticipated tariffs helped lift exports in Q1, continuing a trend that emerged in Q4 2024. In March, exports reached USD 313.9 billion, the second-highest monthly value on record. Exports rose by 5.8 percent year on year in Q1 (in USD terms), with a 12.4 percent surge in March, though base effects from weak growth in the same period last year also contributed.
- Exports to the United States grew by 4.5 percent year on year in Q1, while shipments to the EU increased by 3.7 percent. However, ASEAN was the strongest driver as exports rose by 8.1 percent, boosted by sharp increases to Vietnam (16.5 percent), Thailand (17.9 percent), and Indonesia (11.9 percent). Trade with alternative partners will become increasingly important as China steps up efforts to reduce reliance on the United States.
- China’s trade surplus hit a record USD 272 billion in Q1, up 49 percent year-on-year (see Exhibit 6). Growing trade imbalances risk prompting greater pushback from other partners, as Chinese exporters will be under pressure to divert trade away from the United States.
- Persistently weak import demand is key factor in China’s growing trade imbalances. In USD terms, imports contracted by 7 percent year-on-year in Q1. Pressure on the government to boost consumption is intensifying, but even an effective stimulus program may not lift imports significantly, as demand is likely to be met by domestic producers.
- Falling commodity prices in key import items for China also contributed to the decline in overall imports. The value of imported soybeans, iron ore, crude oil, and natural gas contracted more sharply than their volumes (see Exhibit 7). The weakening global economic outlook could drive prices even lower.
What to watch: After rollercoaster trade war rhetoric in April, the first indications of the actual impact of tariffs and export controls will come with Q2 data.
Financial Markets: Credit growth recovers in volatile environment as PBOC signals more support
![]() Hover over/tap the charts to see more details.
Hover over/tap the charts to see more details.
Exhibit 8
- China’s central bank, the People’s Bank of China (PBOC), refrained from major policy rate cuts in Q1 but signaled further support. Policymakers appear to be taking a wait-and-see approach, bracing for the trade war’s impact on both the economy and the currency. If economic difficulties materialize, then more monetary easing is likely to follow in Q2.
- The “moderately loose” monetary policy for 2025, announced by the PBOC in December, has started to kick-in. Growth of aggregate financing, a broad measure of liquidity in the economy, continued to accelerate as it has done over the past six months. In March, it reached 8.4 percent year on year, the highest growth since May 2024 and up from 8 percent at the beginning of the quarter.
- New credit extensions gathered pace as financing to the real economy grew by CNY 2.4 trillion in Q1, compared to Q1 2024. Credit growth was driven by loans to large firms and government bonds but credit demand from households showed some signs of improvement (see Exhibit 8).
- Financial markets were highly volatile in Q1 (see Exhibit 9). Excitement over AI firm DeepSeek’s breakthrough in mid-January was followed by a correction, as the government issued modest policy plans in February. Looming trade tensions further dampened sentiment. In response, the PBOC extended liquidity support and, the national team - group of state-backed institutional investors- intervened in late March, and several major firms launched share buyback programs.
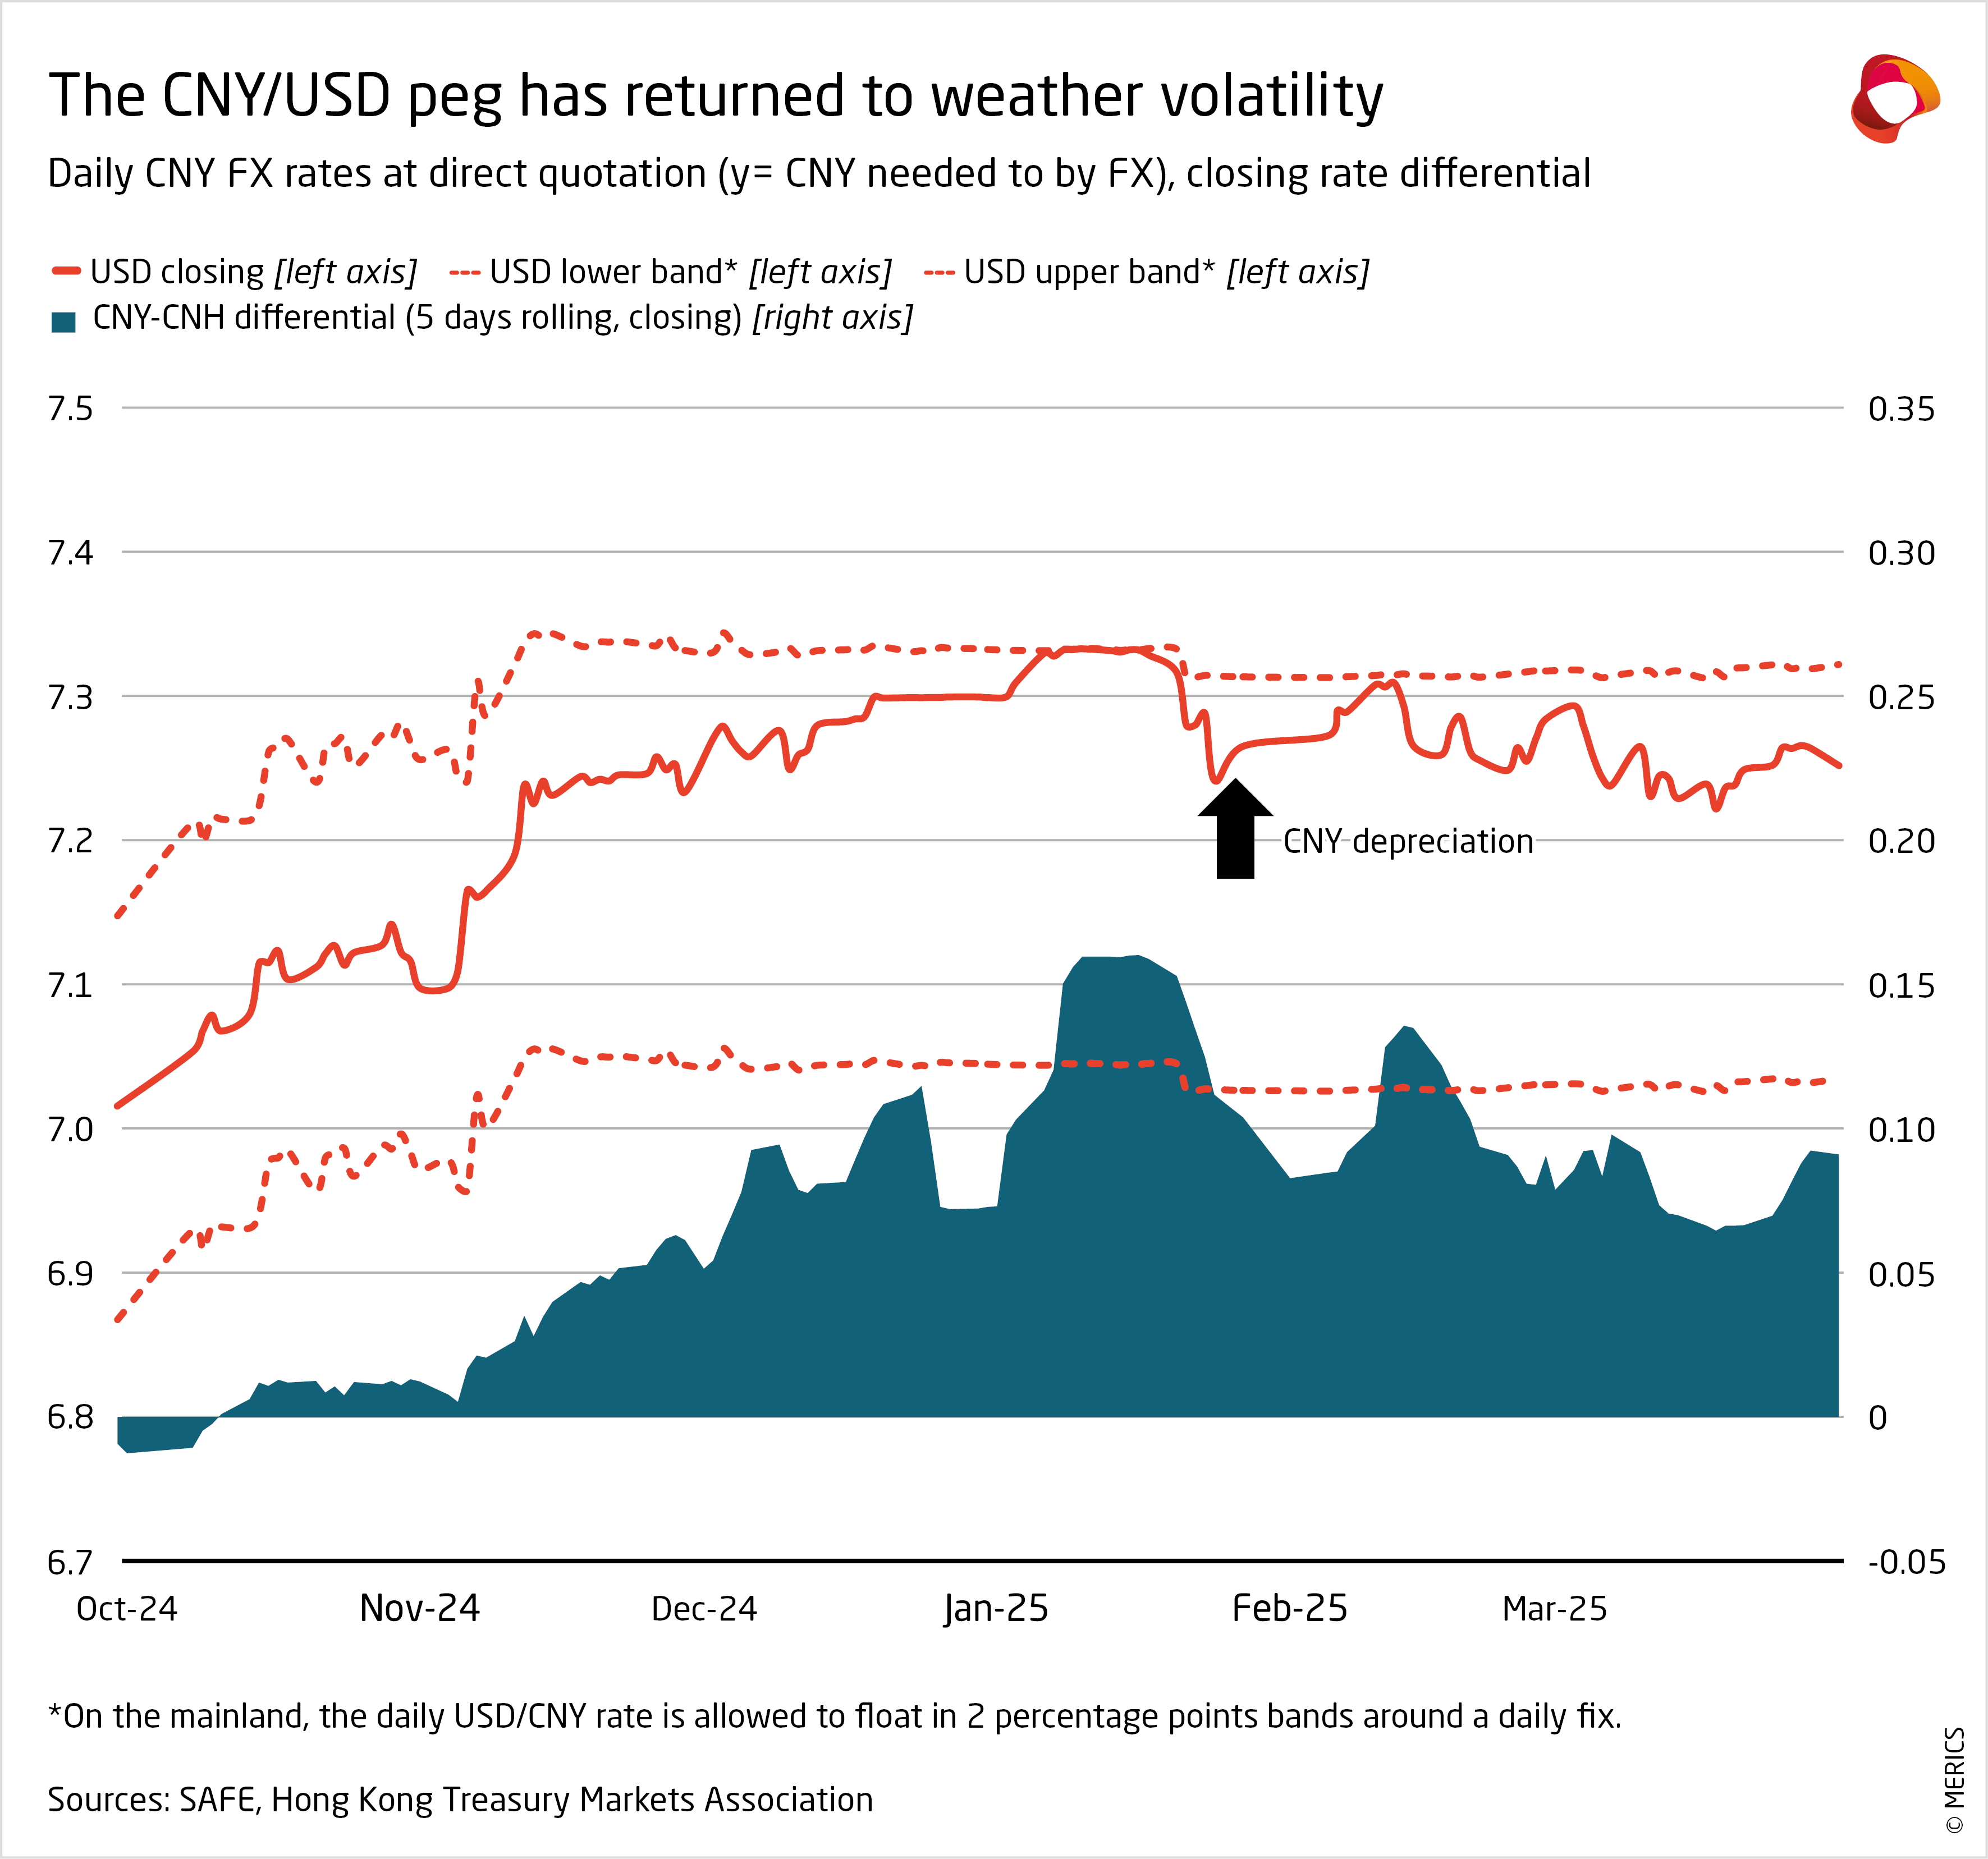
- The apparent stability of the CNY/USD rate is misleading; currency markets are under pressure. In defense of its currency, Beijing reverted to an implicit USD peg. From January 20 (Trump’s inauguration) to the end of Q1, the mainland rate hovered tightly between 7.17 and 7.18, levels last seen in 2008. However, the weaker CNY in Hong Kong’s more liberalized market points to ongoing depreciation pressure beneath the surface. Depreciation pressure will need to be factored in as China ramps up its monetary support.
What to watch: The escalating trade confrontation with the United States is turning Chinese financial markets into a fully policy-driven environment and additional support measures are likely before long.
Investment: Manufacturing and infrastructure outweigh the real estate slump
Exhibit 10
![]() Hover over/tap the charts to see more details.
Hover over/tap the charts to see more details.
Exhibit 11
- After six consecutive months of decline, fixed asset investment rebounded in Q1. Year-to-date growth accelerated from 3.2 percent in December to 4.2 percent in March. Excluding the real estate sector, growth was significantly stronger, expanding by 8.3 percent in March (see Exhibit 10). In the coming months, the government is likely to expand support measures to stabilize investment and offset trade war uncertainties.
- Real estate investment is now contracting for the third consecutive quarter as the sector continues to weigh down the economy. Despite efforts to shore up sentiment, investment showed little improvement in Q1, shrinking by 9.9 percent year on year compared to a 10.6 percent decline at the end of last year.
- Infrastructure investment strengthened, a sign of more stimulus coming online. Growth accelerated by 5.4 percent, the highest rate in 10 months, though only a modest uptick from the 4.2 percent seen at the end of last year. Traditional infrastructure projects in roads and railways barely expanded, though water transport projects surged by over 30 percent.
- Investments in manufacturing continue to outpace the expansion in overall investments. Since January 2024, growth has been remarkable stable, fluctuating consistently between 9.4 and 9 percent (see Exhibit 11). Investment in the automotive sector jumped by 27.5 percent in Q1, after only growing 7.5 percent last year.
- To support equipment renewal and technological upgrades, the government is providing investment and interest subsidies. This has contributed to renewed momentum in equipment purchases, which continued to grow from already elevated levels in 2024; growth accelerated to 19 percent year on year in Q1, up from 15.7 percent in December.
- Agriculture investment shot up from only 2.6 percent last year to 16 percent in Q1 - the highest level recorded since 2021. The uptick was mainly due to stronger investment in farming, forestry and agricultural services, which all expanded by over 20 percent.
What to watch: Even a slight improvement in the battered real estate sector would alleviate the need for more stimulus.
Prices: Deflation concerns worsen on fears of trade war
Exhibit 12
![]() Hover over/tap the charts to see more details.
Hover over/tap the charts to see more details.
Exhibit 13
- China’s economy remained in the grip of deflationary pressure in the first quarter of 2025. Stimulus measures introduced at the end of 2024 have failed to make an impact. China is now in the third consecutive year of deflation concerns. Deflation may soon worsen, as the fallout of the fast-escalating trade war with the United States could stack up unsold exports. The government has announced yet more efforts to boost demand, but China’s economy is unlikely to shake of deflation anytime soon.
- After improving steadily since October 2024, the producer price index (PPI) ended its slow climb in March. The PPI contracted 2.5 percent in March year on year, after 29 consecutive months with falling prices. Uncertainty about external demand for exports and continuous weak domestic demand is likely to push down prices further.
- Weak consumer demand is a key factor in PPI’s continued decline (see Exhibit 12), though slowing demand industrial inputs such as energy also had a big role. Factory gate prices for durable consumer-oriented goods dropped hard, falling by 3.4 percent year on year in March, the fastest pace in over 20 years.
- Anticipating more downward pressure on prices, the 2025 official consumer inflation target was lowered to 2 percent. It was the first downward adjustment since 2015. But reaching this lower target will be an uphill battle as the consumer price index (CPI) contracted by 0.1 percent in Q1 year on year, with prices only increasing in January (0.5 percent).
- Core inflation fared slightly better than the overall CPI. After stripping out more volatile energy and food prices, prices increased by 0.3 percent in Q1 compared to the same period last year. But in February (-0.1 percent) core inflation dipped into deflation for the first time since January 2021.
- Fallout from the government-induced real estate crackdown continues to damp down housing prices. All of the 70 cities tracked by the National Bureau of Statistics (NBS) reported falling prices in March (see Exhibit 13). Although price declines have eased since dipping to a low point in October last year, average prices for newly constructed houses still declined by 5 percent in March year on year.
What to watch: If the steep US tariff hikes become a reality, unsold exports are likely to generate a deteriorating PPI, slicing into already thin profit margins.
Labor Market: Stabilizing employment remains a key concern for Beijing
Exhibit 14
![]() Hover over/tap the charts to see more details.
Hover over/tap the charts to see more details.
Exhibit 15
- The official government target aims to create over 12 million new urban jobs in 2025, with a target unemployment rate of around 5.5 percent. However, a record 12.2 million university graduates will enter the job market, exceeding the employment target for the first time. Policy makers are under mounting pressure to absorb the new labor market entrants to stabilize employment. The obstacles to their task are headwinds in economic growth, structural skills mismatches, and the trade war with the US, all of which are complicating employment prospects in 2025.
- Rising unemployment figures underscored the challenges. Surveyed urban unemployment reached a two year high in February (5.4 percent), though it eased slightly in March (see Exhibit 15). Youth unemployment, a key concern for the government, crept up to 16.5 percent in March, higher than the 15.7 percent in December.
- China’s already sluggish labor market continues to face headwinds in 2025, as companies are cautious about hiring in a challenging and unpredictable economic environment. Companies reported hiring intentions reflected these worries: the purchasing managers’ sub index on manufacturing employment (48.2) and services (45.8) both fell in March (values below 50 indicate shrinking employment). The value for services was at its lowest level since November 2024.
- In the first two months, a total of 1.54 million new urban jobs were created. While this was slightly up from the 1.46 million created in the same period last year, sentiment has yet to improve. Both the outlook on employment and income expectations by households remain depressed (see Exhibit 16).
- Both the central and provincial governments continue to roll out new policies to support employment. These include expanding vocational training programs and promoting entrepreneurship among young people. Reflecting the challenging environment, tax incentives for small and medium sized enterprises to encourage hiring were extended until the end of 2027 and reduced unemployment insurance contributions were extended until end of 2025.
What to watch: More labor market support can be expected to support small and medium sized companies hurt by the trade war.
Retail: Consumption picks up steam and helps lift GDP growth
Exhibit 16
![]() Hover over/tap the charts to see more details.
Hover over/tap the charts to see more details.
Exhibit 17
- Consumption got off to a promising start in 2025. Retail spending expanded by 5.9 percent in March year on year, the fastest pace since December 2023. A strong rebound in consumption by urban households was a key factor (see Exhibit 1). This is in line with ongoing improvements in household sentiment. In March, willingness to consume reached the highest level in nearly two years on the National Bureau of Statistics’ index.
- The government is making greater efforts to support consumption after last year’s relatively lackluster measures. In March, the State Council issued a 'Special Action Plan to Boost Consumption,' aimed at ad-dressing the structural challenges holding back demand, including boosting incomes and easing financial burdens on families through childcare subsidies.
- Trade-in programs for goods were part of last year’s support package and still play a key role in boosting demand. The list of subsidized products has grown in 2025. Compared to last year, the government has doubled financial support for the programs and issued CNY 300 billion in ultra-long special bonds to fund them.
- Consumers are taking advantage of trade-in programs to buy subsidized products, with particularly strong demand for household appliances and mobile phones (see Exhibit 2). It remains to be seen whether this support can sustain consumption growth but, for now, the program is having a positive impact.
What to watch: Expect more government support programs, in order to ensure consumption growth keeps up its momentum.
Autor(en)

Ehemaliger Chief Economist

Ehemaliger Senior Economist (Büro Brüssel)
Autor(en)
Ehemaliger Chief Economist
Ehemaliger Senior Economist (Büro Brüssel)